ChIRP-Seq Analysis Workflow: From Reads to Targets
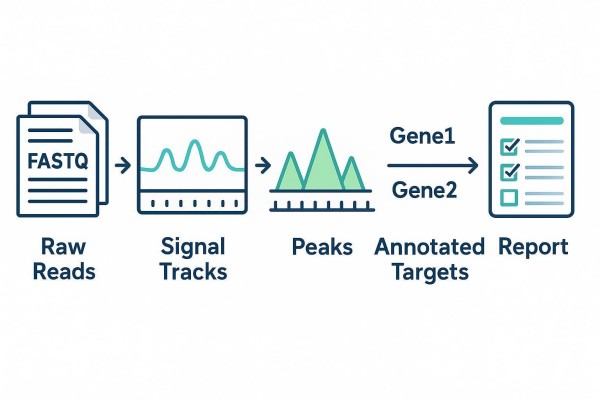
A strong ChIRP-Seq analysis workflow does more than produce a peak list. It turns raw sequencing data into interpretable binding maps and then into annotated, prioritized targets that teams can review, reuse, and carry into downstream decision-making. This guide lays out an end-to-end, reproducible, deliverable-first pathway—from intake and preprocessing through peak generation, annotation, comparison across conditions, and reporting—so stakeholders can see how reads become usable results.
Key takeaways
- The hero deliverable is a Peak-to-Target prioritized table that connects peaks to genomic context and candidate genes with transparent logic.
- Analysis-ready signal comes before biology: consistent preprocessing, alignment review, and normalized bigWig tracks are non-negotiable.
- Peak calling serves RNA-guided occupancy mapping; parameters should match observed signal shapes rather than a one-size-fits-all recipe.
- Annotation governs interpretability; nearest gene is a starting heuristic, not proof of function.
- Differential occupancy focuses on shared, gained, lost, or shifted patterns and should roll up into concise, comparison-ready summaries.
- Functional narratives start from binding patterns and regulatory context; avoid equating proximity with function.
- Final reports must be reviewable and reusable, documenting versions, parameters, and interpretation boundaries.
Methodology note
This guide is written for bioinformatics core leads and multi-stakeholder project teams who need ChIRP-Seq results to be clear, reusable, and easy to document—not just "processed." The workflow is deliberately deliverable-first: it treats browser-ready signal tracks, parameterized peak sets, and a Peak-to-Target table as primary analysis artifacts that can be reviewed and carried into downstream validation planning. Where community practices come from ChIP-seq–centric workflows, they are referenced as optional points of comparison rather than default standards for RNA-guided occupancy mapping.
What a ChIRP-Seq Analysis Should Deliver
A useful ChIRP-Seq analysis converts raw reads into coherent binding maps and then into interpretable targets. The minimum outcome bundle typically includes: normalized signal tracks suitable for IGV/UCSC, a clearly parameterized peak set, an annotated peak table, condition-level comparison summaries where relevant, and a Peak-to-Target prioritized table aligned to the study question.
Why make the Peak-to-Target table the hero deliverable? Because it concentrates the pipeline's logic—coordinates, feature category, distance to TSS, enrichment summary, comparison status, and a cautious interpretation note—into one structured artifact that collaborators can inspect, interpret, and reuse. Rather than leaving target nomination implicit, the table makes the prioritization logic visible.
Example schema (adapt to study-specific logic):
| Field | Definition | Notes |
|---|---|---|
| Peak_ID | Stable identifier mapping to the BED row | e.g., sample_peak_000123 |
| Chrom | Chromosome | Match assembly naming |
| Start | 0-based start | BED-compatible |
| End | 1-based end | BED-compatible |
| Feature_Category | Promoter, TSS-proximal, Gene body, Enhancer-like, Intergenic | Document classification rules |
| Nearest_Gene | Gene symbol/ID nearest to peak | Heuristic; not proof of function |
| Distance_to_TSS | Signed bp distance to nearest TSS | Negative = upstream |
| Context_Note | Regulatory context (e.g., enhancer overlap) | Optional overlaps |
| Enrichment_Summary | Peak intensity metric and q-value | Define how computed |
| Condition_Pattern | Shared / Gained / Lost / Shifted | Based on differential logic |
| Priority_Tier | High / Medium / Low | Rule-based, documented |
| Interpretation_Note | Short, decision-ready rationale | Avoid overclaiming |
To help readers dive deeper into field definitions and typical outputs for peak discovery and annotation, see the overview on Epigenomic Peak Calling and Annotation hosted by CD Genomics: Epigenomic Peak Calling and Annotation.
Mini worked example: turning peaks into a reviewable short list
A compact way to operationalize the Peak-to-Target table is to treat it as the decision layer between raw peak calls and follow-up experiments. Consider a simple design with two conditions (A vs B) and two replicates per condition (or two probe pools). One practical, reproducible approach is:
- Generate browser-ready signal for each replicate and control using one documented parameter set.
- Call peaks with a signal-shape rationale that matches the observed enrichment pattern.
- Build the Peak-to-Target table using explicit prioritization rules, then assign a tier.
Even a three-row excerpt in the final report helps collaborators understand why a locus was shortlisted and how the decision logic was applied.
From Raw Reads to Analysis-Ready Signal in the ChIRP-Seq analysis workflow
The first goal is not biological interpretation but consistent inputs for downstream analysis. That requires clean metadata, uniform preprocessing, alignment with mapping review, and normalized coverage tracks that others can inspect and reuse.
Data Intake and Metadata Review
Before touching reads, confirm sample naming schemes, replicate relationships, control design, and the reference genome and annotation versions. This prevents drift in later comparisons and ensures browser tracks and peak files align to the same assembly. When possible, stage a minimal data dictionary that records sample roles, probe-pool membership where applicable, and any batch or condition labels.
Preprocessing Before Alignment
Adapter trimming, removal of low-quality ends, and filtering of very short reads should be performed with consistent parameters across all samples. A brief contamination screen (e.g., rRNA content, common adaptors) provides early warning. The goal is not to chase tiny differences but to standardize handling so downstream steps are comparing like with like.
Alignment and Mapping Review
Map reads to the chosen assembly, then review key indicators: overall mapping rate, multi-mapping prevalence, duplicate patterns, and consistency across replicates or probe pools. The point here is fitness-for-purpose: are the alignments reliable enough to build signal tracks and peak candidates? Document aligner versions and essential parameters in a methods appendix for auditability.
What Counts as Analysis-Ready Data
"Alignment finished" is not the finish line. Analysis-ready status means the data can be rendered into normalized signal tracks and used to generate a candidate peak set under clearly stated rules. For delivery, bigWig coverage tracks normalized to sequencing depth or effective genome coverage are preferred for cross-sample comparisons. Guidance on normalization choices for coverage tracks is available in the deepTools documentation for bamCoverage, which outlines options such as RPKM/CPM/BPM and RPGC normalization and their parameterization in practice; see the official manual: deepTools bamCoverage documentation. For browser compatibility and efficient delivery, the UCSC bigWig format guide is a canonical reference.

How Binding Maps Are Built
Binding maps are produced by turning aligned reads into enrichment tracks and then into peak candidates that summarize RNA-associated occupancy. Signal construction and peak calling should echo the actual signal architecture observed in the data.
Signal Tracks and Regional Enrichment
Start by generating normalized coverage tracks for each sample and control. Use consistent bin sizes and normalization schemes, and record duplicate handling and read-extension rules. Inspect several representative loci in a genome browser to establish a shared visual vocabulary within the team. Seeing the signal—where it is sharp, broad, clustered, or diffuse—grounds later choices for peak calling and interpretation. For conversion utilities and format notes, the UCSC bedGraph and bigWig documentation and the IGV Desktop User Guide are reliable references.
Peak Calling for Occupancy Mapping
Peak calling should be tuned to the occupancy pattern. For sharp local enrichments, narrow-peak settings are reasonable; for diffuse domains, broad or gapped modes may be more appropriate. MACS is a widely used reference framework for this kind of parameterization, but the key is not the software name alone—it is the fit between peak mode, observed signal shape, and transparent reporting of how the peak set was generated. Always accompany algorithmic output with visual inspection and summary metrics so peak sets are not treated as opaque.
When projects use odd/even probe pools, a practical approach is to call peaks per pool and then intersect to retain higher-confidence sites. This convention reduces off-target capture but is not a universal standard; if adopted, document the intersection criterion (e.g., minimum overlap in bp or fraction), counts per pool, and the size of the common set.
Different Signal Shapes Need Different Expectations
Not every sample produces crisp spikes. Some long noncoding RNAs yield broad occupancy or clusters of moderate enrichment across a region. Others show distal multi-locus patterns tied to enhancer-rich neighborhoods. The workflow should be flexible enough to match interpretation to shape: use broad models for wide domains, consider subpeak grouping for clusters, and pair all of it with transparent browser views.
What the Binding Map Should Look Like at This Stage
By this point, a project should have standardized bigWig coverage, a preliminary peak set with clear parameters and controls, and several representative loci captured as browser snapshots. For readers seeking a refresher on general principles of peak calling and feature-aware annotation, a concise overview is available here: Epigenomic Peak Calling and Annotation.
How Peaks Become Annotated Targets
Annotation is where coordinates turn into hypotheses. The job is to place peaks into regulatory categories, map them to nearby or plausible genes, and add contextual notes that narrow which candidates deserve follow-up.
Annotating Peaks by Genomic Feature
Categorize peaks into promoter, TSS-proximal windows, gene body, enhancer-like, and intergenic regions using consistent, documented rules. Tools such as ChIPseeker support this kind of classification and provide helpful visualization utilities; Yu and colleagues described its feature-based annotation framework in Bioinformatics, 2015. Readers can consult the primary paper for the conceptual underpinnings: ChIPseeker paper (Bioinformatics, 2015).
Nearest Gene Is a Starting Point, Not the Final Answer
Nearest-gene assignment is a fast heuristic, not a functional verdict. Treat it as a pointer and combine it with feature class and distance to shape a hypothesis. Promoter/TSS-proximal peaks often support transcriptional initiation coupling; distal enhancer-like signals suggest longer-range regulation that may require additional evidence before naming a target with confidence.
How to Handle Distal and Multi-Locus Occupancy
Distal peaks and multi-locus clusters are common in enhancer-rich regions. Record them as region-level patterns and carry them forward as hypotheses rather than mechanistic claims. This keeps interpretation honest and sets up optional integrative analyses if expression or chromatin-state data become available.
What an Annotated Peak Table Should Include
A credible annotated peak table lists coordinates, feature category, nearest or candidate gene with a signed distance-to-TSS, a compact enrichment summary, and a short note explaining why the entry matters. It also reserves space for a prioritization tier and a condition pattern if differential analysis is in scope. Capturing this information clearly enables the Peak-to-Target table to roll up the most decision-ready rows.

For readers who want a comparative backdrop across RNA–chromatin methods without leaving this guide's focus, a neutral resource is available here: Decoding lncRNA Interactions: ChIRP-Seq vs PIRCh-Seq, RIP-Seq and CLIP/eCLIP.
How to Compare Occupancy Across Conditions
After basic QC and peak generation, condition-level comparison asks whether occupancy is stable or changes in interpretable ways.
What Comparison Should Answer
The purpose is not to redo QC but to clarify whether occupancy is shared between conditions or shows gained, lost, or shifted patterns. A useful comparison identifies stable loci as anchor points and highlights responsive regions that might connect to condition-specific mechanisms.
Shared and Condition-Specific Peaks
Construct a consensus peak set to avoid comparing different coordinate systems, then categorize peaks as shared or condition-specific by presence/absence criteria and statistical evidence. Where replicates are available, methods that count reads per peak and model differences across conditions help flag robust changes.
How to Summarize Differential Occupancy Clearly
Keep summaries simple: a tallied breakdown of shared, gained, and lost sets, a few representative loci with browser views, and a comparison-ready table that merges identifiers, effect sizes, and q-values. Differential binding frameworks such as DiffBind illustrate a standard way to build a consensus peak set, extract counts, and test contrasts, but the exact implementation should be matched to the study design and reported transparently.
What Makes a Comparison Biologically Useful
Results should support a next step. That usually means integrating the comparison categories with annotation context and the study's question, so that a reader can jump from a category (e.g., gained distal peaks) to a short list of candidates that deserve validation.
How to Interpret Peaks Without Overclaiming Function
Interpretation begins with occupancy patterns and regulatory context, not proximity alone. Careful, transparent language helps keep the evidence aligned with a plausible, testable hypothesis.
From Binding Pattern to Regulatory Hypothesis
Different occupancy patterns support different hypotheses. Promoter-biased signals align with initiation or promoter-proximal pausing logic; enhancer-biased and distal multi-locus occupancy point toward long-range regulation; broad occupancy often indicates regional effects or scaffold-like behaviors. Framing hypotheses around the observed pattern keeps claims grounded in the data.
How to Use Functional Annotation Carefully
Gene sets, pathways, and locus categories help with target prioritization, not arbitration of mechanism. Present them as supporting context—"supports a regulatory hypothesis"—and avoid definitive language without orthogonal evidence.
Why Proximity Alone Is Not Enough
A peak near a gene does not make that gene a functional target. Proximity is one piece of a larger puzzle that includes feature class, distance, regulatory environment, comparative behavior across conditions, and, when available, coupling to expression changes.
What a Clear Interpretation Looks Like
A careful narrative references the occupancy pattern, shows at least one representative locus view, states the candidate-gene logic and distance, and clarifies boundaries: what the data support, what remains speculative, and what a next follow-up experiment might test. This style improves consistency in interpretation and makes collaboration easier.

How to Integrate ChIRP-Seq With Expression Data
ChIRP-Seq shows where an RNA occupies chromatin; it does not by itself say whether that occupancy changes transcriptional outputs. When the study aims to prioritize functionally relevant loci, integrating expression data is often worth the additional effort.
Why Binding Maps Are Not the End Point
Binding maps reveal potential regulatory touchpoints. To triage candidates, pairing occupancy with RNA-seq can elevate loci where a change in occupancy coincides with a directionally consistent expression change in nearby or linked genes. This is still prioritization, not proof, and should be phrased as such.
What Integration Can Reveal
Integration can highlight binding–expression coupling, condition-specific occupancy with matched transcriptional changes, and a refined short list of candidates for validation. It also informs which promoter-proximal versus distal signals appear more likely to play a role in observed expression differences.
How to Build an Integrated Candidate Table
Extend the Peak-to-Target table to include gene-level expression metrics and flags for concordant changes. Keep the schema simple: annotated peaks, occupancy category or effect, linked gene(s) with expression fold change and FDR, and a revised priority tier. Document how links between peaks and genes were assigned and what thresholds were used to call expression changes.
When Integration Is Worth Doing
Integration is most impactful once the central question has evolved from "where does the RNA bind?" to "which loci are most likely relevant to function?" Projects that need short lists for validation benefit disproportionately from this step.
What a ChIRP-Seq Report Should Include
A good report makes the path from processed reads to final targets visible and reviewable. It anticipates what collaborators, core managers, and external reviewers will ask and answers those questions within the document.
Minimum Deliverables
The essential outputs include normalized signal files for genome browsers, a peak list with parameters and controls recorded, an annotated peak table with feature classes and distances, a concise comparison summary when conditions exist, a prioritized Peak-to-Target table, and several figure-ready locus views that illustrate key patterns. Delivery should include assembly/annotation versions and file schemas so others can reproduce analyses locally.
What Should Be Documented Clearly
Spell out the reference genome and annotation sources, how peaks were generated (tools, modes, key parameters), how comparisons were constructed (consensus rules, statistical models), and how annotation and prioritization logic were defined. Where replicate-concordance practices are borrowed from community standards, say so. For instance, ENCODE's Irreproducible Discovery Rate (IDR) framework is widely used in ChIP-seq to assess replicate stability; while ChIRP-Seq is RNA-guided, the practice of using relaxed per-replicate peak sets followed by IDR-style concordance can be adapted with caveats. Readers can consult the ENCODE pages on transcription factor and histone ChIP-seq standards and the IDR toolkit for background: ENCODE TF ChIP-seq standards (ENCODE4), ENCODE histone ChIP-seq overview, and the open-source IDR toolkit on GitHub. For a practical training walkthrough, see the HBC Training lesson on IDR.
Which Figures Improve Interpretability
Useful visuals include a global signal overview, a compact feature-distribution summary of peaks, a handful of representative genome-browser views with consistent scaling, and an integrated target-prioritization figure or small table that acts as a visual index to the hero deliverable.
How to Make the Report Reusable
Design the report so wet-lab collaborators, project managers, and external partners can all track how and why specific loci were elevated for follow-up. Include software versions, container tags or environment files, and, where helpful, UCSC/IGV session files. For a concise overview of how structured deliverables and standardized analysis artifacts are typically organized for epigenomic projects, see: Epigenomic Data Analysis.
Reproducibility checklist (minimum)
To keep the deliverables audit-ready, a report should include a small "methods appendix minimum" that records:
- Reference genome build and gene annotation release (plus chromosome naming conventions)
- Exact software versions for alignment, signal generation, peak calling, annotation, and differential analysis
- Key parameters that materially change results (normalization mode, bin size, peak mode and thresholds, consensus rules)
- A file manifest listing all delivered bigWig/BED/tables and their schemas
- Optional but helpful: checksums for large files and an IGV/UCSC session file so figures can be regenerated consistently

FAQ - What Should a ChIRP-Seq Report Include?
What Does ChIRP-Seq Bioinformatics Actually Output?
At minimum, it outputs normalized signal tracks for genome browsers, a parameterized peak set, an annotated peak table with feature categories and distances, concise comparison summaries when conditions are present, and a Peak-to-Target prioritized table that records the rationale for shortlisting candidates.
How Is ChIRP-Seq Peak Analysis Different From Standard Peak Analysis?
The emphasis is on RNA-guided occupancy rather than antibody-target binding, so peak calling settings and interpretation are tuned to observed signal shapes, often incorporate probe-pool logic when relevant, and funnel quickly into feature-aware annotation that informs target hypotheses rather than stopping at a generic peak list.
How Do You Link ChIRP-Seq Peaks to Target Genes?
Nearest gene is a heuristic; robust linkage blends feature type, distance to TSS, regulatory context, and, when available, integration with expression or chromatin-state data to refine candidacy without asserting function prematurely.
Can ChIRP-Seq Be Integrated With RNA-seq?
Yes; adding RNA-seq improves prioritization by highlighting loci where occupancy changes align with directionally consistent expression shifts, but the output should still be framed as hypothesis support rather than proof of mechanism.
What Should a ChIRP-Seq Report Include?
A strong report makes the chain from processed reads to binding maps to annotated targets visible, documents versions and parameters, and provides figure-ready examples plus a prioritized target table so collaborators can understand and reuse the results.
Closing and a Practical Example
Teams frequently operationalize the hero deliverable by standardizing a Peak-to-Target table alongside IGV-ready tracks, documented parameters, and a short interpretation appendix. Teams often operationalize the hero deliverable by standardizing a Peak-to-Target table alongside browser-ready tracks, documented parameters, and a short interpretation appendix. When structured ChIRP-Seq deliverables are needed, it helps to work with a provider that documents signal generation, peak logic, annotation rules, and target prioritization in a transparent format. CD Genomics offers ChIRP-Seq & ChIRP-MS services for research use only (RUO) and can align deliverables with this type of reporting structure.
References
- Alfeghaly, Charbel, Isabelle Behm-Ansmant, and Sylvain Maenner. "Study of Genome-Wide Occupancy of Long Non-Coding RNAs Using Chromatin Isolation by RNA Purification (ChIRP)." Small Non-Coding RNAs, edited by Mathieu Rederstorff, vol. 2300, Methods in Molecular Biology, Humana, 2021, pp. 107–117.
- Khlebnikov, Daniil A., Arina I. Nikolskaya, Anastasia A. Zharikova, and Andrey A. Mironov. "Comprehensive Analysis of RNA–Chromatin, RNA–, and DNA–Protein Interactions." NAR Genomics and Bioinformatics, vol. 7, no. 1, 2025, lqaf010.
- Limouse, Charles, Owen K. Smith, David Jukam, Kelsey A. Fryer, William J. Greenleaf, and Aaron F. Straight. "Global Mapping of RNA-Chromatin Contacts Reveals a Proximity-Dominated Connectivity Model for ncRNA-Gene Interactions." Nature Communications, vol. 14, 2023, article 6073.
- Nakato, Ryuichiro, and Toyonori Sakata. "Methods for ChIP-seq Analysis: A Practical Workflow and Advanced Applications." Methods, 2020.
- Ryabykh, G. K., D. E. Mylarshchikov, S. V. Kuznetsov, et al. "RNA–Chromatin Interactome: What? Where? When?" Molecular Biology, vol. 56, 2022, pp. 210–228.
- Wang, Jiankang, and Ryuichiro Nakato. "Churros: a Docker-Based Pipeline for Large-Scale Epigenomic Analysis." DNA Research, vol. 31, no. 1, 2024, dsad026.