Cell-of-Origin Analysis in cfDNA Methylation Studies: What Can Be Inferred and How to Design the Project
Cell-of-origin analysis in cfDNA methylation uses tissue-linked methylation patterns retained in circulating DNA to estimate the relative contribution of different tissues or broad cell classes to a plasma sample. It is a research-use biological inference: credibility depends on sample quality and consistency, the suitability of the reference methylation atlas, and an analysis design that respects modeling assumptions and uncertainty. Think of it as a proportional estimate that is most reliable for group-level trends and broad tissue classes when the study is thoughtfully designed and executed.
Key takeaways
- Cell-of-origin from cfDNA methylation is strongest for relative contribution shifts across broad tissue classes, especially in group comparisons with controlled pre-analytics and a well-matched reference atlas.
- Limits matter: closely related tissues can blur, low-abundance contributors may be unstable, and reference mismatch or batch drift can mimic biology.
- Study design drives interpretability. Predefine inputs, replicates, feature coverage, cohort contrasts, and interpretation boundaries before sequencing.
- The reference atlas and deconvolution framework must fit your biological question and assay; unknown components should be modeled or acknowledged.
- Deliverables should be reanalysis-ready with transparent QC, signal tracks/tables, model parameters, and versioned methods.
What Cell-of-Origin Analysis Means in cfDNA Methylation Studies
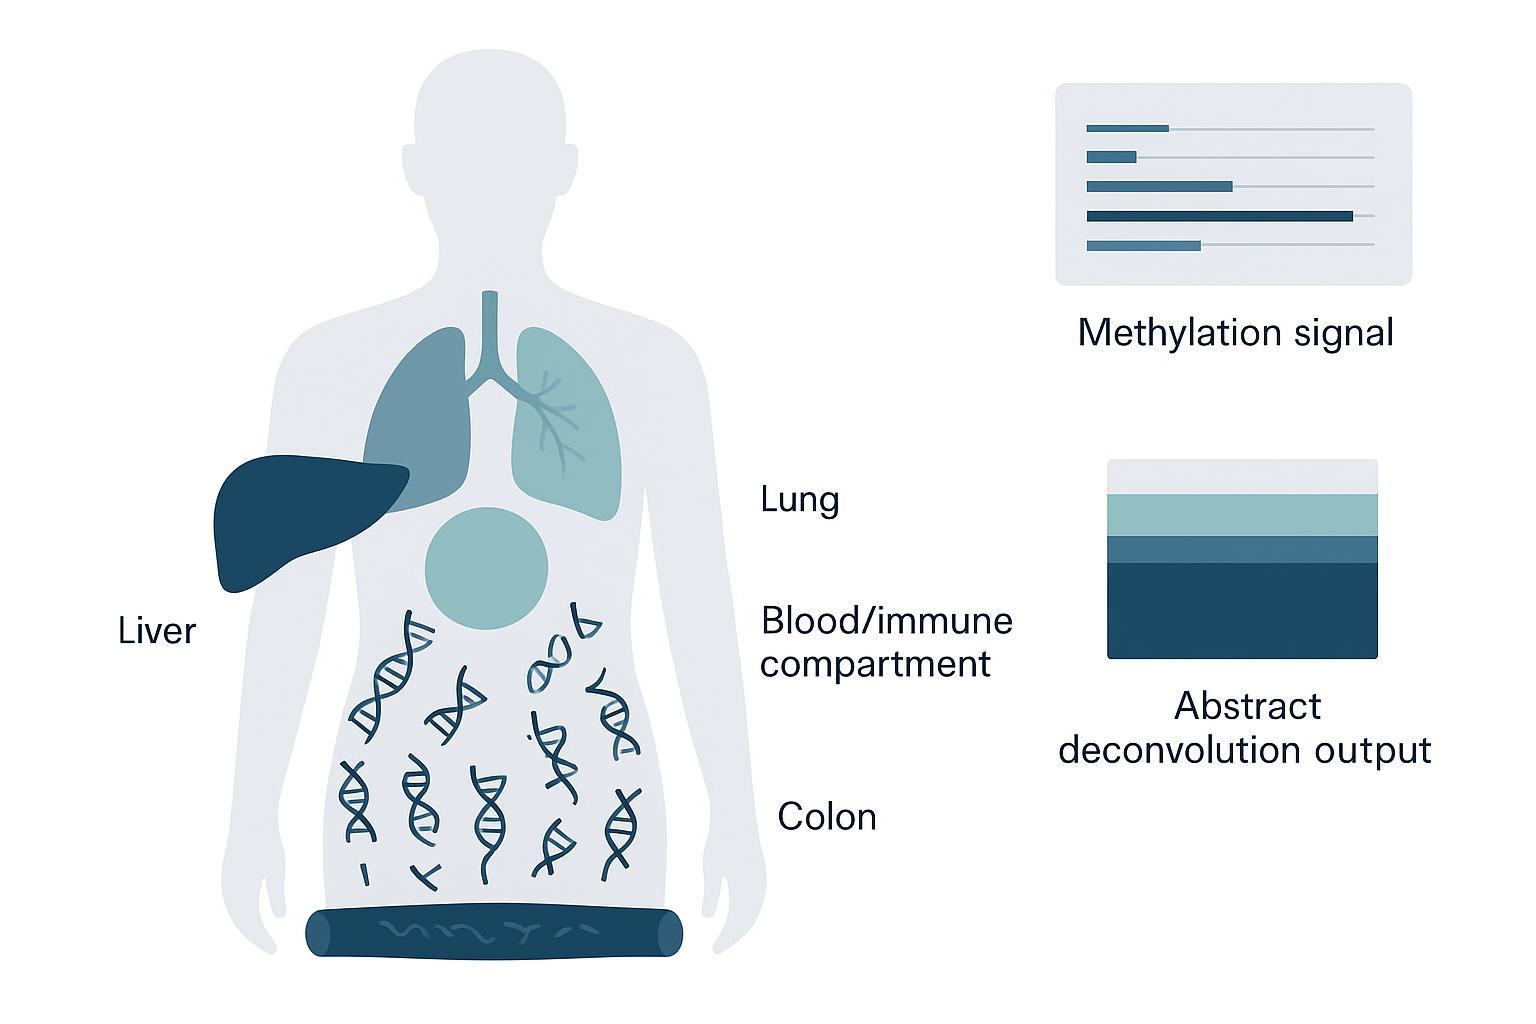
Cell-of-origin analysis estimates the mixture proportions of cfDNA derived from different tissues by comparing observed methylation features to a reference atlas of tissue or cell-type methylomes. In practice, you obtain a set of methylation signals (CpG- or region-level) from plasma cfDNA, then fit those signals as a combination of reference tissue signatures, resulting in estimated proportions and associated uncertainty.
What researchers are usually trying to learn
Most projects aim to answer whether tissue contributions differ between groups, time points, or conditions. You might ask if liver-derived cfDNA increases in a disease model, if immune-derived cfDNA decreases following an intervention, or whether an unexpected contributor appears that suggests off-target biology or pre-analytical drift. Supervised methods trained on broad atlases—such as the cfSort framework—illustrate how proportion estimates can capture such shifts across many tissues while remaining robust when variability is controlled, as presented in the authors' 2023 report in PNAS; see the supervised atlas and performance details in the cfSort publication: according to the authors, the method leverages a large atlas and benchmarks sensitivity to low-proportion tissues (PNAS 2023).
Why methylation is useful for tissue inference
Methylation is cell-type- and tissue-linked, providing discriminative features beyond nucleotide sequence. While sequence is largely shared across tissues, methylation patterns vary by cell identity and state, creating a signal space that, when compared to an atlas, supports proportional inference. Read-level strategies—those that analyze patterns within individual cfDNA fragments—can further boost sensitivity for rare contributors; CelFEER adapted read-level modeling to plasma mixtures and reported higher correlation to truth in several tests (NAR Genomics and Bioinformatics 2023).
What This Approach Can and Cannot Tell You
Set clear expectations before you start. Cell-of-origin from cfDNA methylation is powerful within its lane—and the lane has edges.
What it can tell you with confidence
You can usually rely on group-level differences in broad tissue classes when your atlas covers the expected contributors, your features are informative at your sequencing depth, and pre-analytical handling is consistent. Studies that evaluate supervised frameworks across multiple tissues report robust detection of relative proportion shifts when effect sizes are moderate to large and confounders are controlled; cfSort's published benchmarks and recent systematic evaluations summarize this performance context (e.g., the method evaluation overview in 2024: Systematic evaluation of methylation-based deconvolution).
What it cannot resolve on its own
Fine-grained separation among very similar tissues or subtypes is often difficult if the atlas lacks strong contrast or if features are under-covered at low depth. Low-abundance contributors near detection limits can vary from run to run, especially in low-input projects. Reference mismatch—missing relevant tissues or cell states—introduces systematic error; likewise, batch drift or pre-analytical differences can masquerade as biology. Methods that explicitly model unknown components reduce, but do not eliminate, this challenge—for example, MetDecode learns an unknown component alongside known tissues to improve robustness under noise and atlas gaps (Bioinformatics 2024).
Why interpretation should stay within RUO boundaries
Because mixture proportion estimates depend on reference coverage, depth, and handling consistency, they're best used for research-use biological inference—mechanistic clues and project planning—rather than individual-level clinical conclusions. Stick to cautious language and predefined interpretation boundaries.
 Cell-of-origin analysis is strongest for relative tissue contribution and group-level comparison, but limited by reference coverage, overlapping methylation profiles, and weak signal.
When a cfDNA Cell-of-Origin Project Is Worth Doing
Cell-of-origin analysis shines when it is used to test clear biological hypotheses at the right resolution and scale.
Good-fit study scenarios
- Translational or mechanism-oriented comparisons where broad tissue classes are expected to shift.
- Early biomarker exploration to see whether trends at the tissue level align with orthogonal evidence (e.g., fragmentomics-based methylation proxies that correlate with CpG methylation patterns in native cfDNA; see the demonstration that cleavage profiles and motif-end ratios track methylation in plasma in PNAS 2022).
- Longitudinal monitoring in controlled cohorts to detect directionality and magnitude of contributor changes at the group level.
Situations where expectations should be lowered
- Sample handling or pre-analytics are inconsistent across groups, or cohort contrasts are unclear.
- The expected signal resides in closely related tissues with weak atlas contrast (see contrasts and feature considerations summarized in the systematic assessment of methylation-based deconvolution strategies, 2022).
- Input is extremely low and depth insufficient to cover informative features, especially without replicates or clear QC gates.
Study Design Decisions That Shape Data Quality
Even the best algorithm can't rescue a poorly designed study. Your decisions before sequencing largely determine the interpretability of cell-of-origin results.
Sample type, handling, and pre-analytical consistency
Define tube type and handling windows up front, and keep them constant within cohorts. Preservative blood collection tubes have been shown to maintain cfDNA integrity longer and curb leukocyte gDNA contamination when processing delays are unavoidable; evaluations in oncology contexts support their suitability when used according to instructions (see a 2023 pre-analytical evaluation of preservative tubes that discusses stability and contamination control: PMC 2023 evaluation). Separately, a reviewed preprint in 2025 reported strong concordance in methylation profiles and deconvolution estimates across certain tube types when processing is standardized, suggesting residual plasma can sometimes be repurposed if pre-analytics are well controlled (eLife reviewed preprint 2025). Beyond collection, minimize freeze-thaw cycles and standardize storage; harmonization guidance recommends limiting plasma freeze-thaw to one cycle where possible and storing isolated cfDNA cold to preserve integrity (Harmonization guidance 2020). Direct methylation-specific error curves are scarce, so follow conservative, documented handling.
Input amount and replicate planning
Low-input projects are feasible, but you should align assay choice with your expected input and coverage needs. Enzymatic conversion often preserves DNA better than bisulfite and can improve coverage at very low input, while bisulfite workflows remain mature and comprehensive when inputs and depth suffice. Affinity-enrichment approaches can tolerate low input and focus on trend-level signals but require rigorous normalization and careful interpretation due to enrichment bias. Whichever chemistry you select, define minimum input thresholds, plan technical and biological replicates where possible, and set re-run rules before you begin. For general comparisons of conversion chemistries and their trade-offs relevant to low-input methylation profiling, see a recent comparative overview (Briefings in Bioinformatics 2024).
Cohort structure and comparison logic
The model's job is to detect proportion differences you design into the study. Be explicit about contrasts (group A vs group B), control for confounders, avoid underpowered subgroup splits, and ensure similar pre-analytical conditions across groups. Pre-registering analysis plans or at least writing a design memo with interpretation boundaries helps guard against post hoc overreach.
 In cell-of-origin projects, sample handling and cohort design often shape data quality as much as the downstream algorithm.
How Reference Atlases and Deconvolution Shape Cell-of-Origin Results
Deconvolution fits your cfDNA methylation features as a mixture of reference signatures to estimate tissue contributions. Performance hinges on whether the atlas contains the right tissues, how features were selected, and how the model handles missing or unknown components.
What makes a reference atlas useful
A useful atlas offers coverage of the tissues and major hematopoietic contributors you expect to encounter, multiple biological replicates, and transparent provenance. It also provides well-annotated markers—either CpGs or regions—chosen for strong tissue specificity and compatibility with your chemistry and depth. In supervised frameworks, broader coverage generally improves robustness for low-proportion tissues, provided batch effects are controlled. For an example of a broad atlas and supervised model that reported robust performance, see cfSort (PNAS 2023).
Why reference mismatch is a major source of error
If a relevant tissue or cell state is absent, the model will redistribute its signal to the most similar available signatures. This is a systematic error, not just noise. Methods that model unknown components can soak up some of this signal and temper false attribution; MetDecode is one such framework that reported improved correlation under noise and atlas gaps (Bioinformatics 2024). The safest path is to select an atlas that matches your biology and to predefine acceptable uncertainty language for plausible unknowns.
Why feature selection matters
Features with strong effect sizes and stable coverage dominate accuracy. Region-level markers often improve specificity and read coverage, while read-level strategies can squeeze more sensitivity from scarce fragments. In practice, start with well-separated tissue DMRs for broad classes, ensure they'll receive adequate coverage at your depth, and then expand marker sets to resolve subtler contrasts if the study supports it. For systematic guidance on marker strategies, see comparative assessments that analyze CpG- and region-level approaches (Systematic assessment 2022). Read-level adaptations such as CelFEER reported gains on low-fraction contributors in simulations and validations (NAR Genomics and Bioinformatics 2023).
 Deconvolution compares cfDNA methylation features with a reference atlas to estimate likely tissue contributions.
For research-use-only projects, many teams look for standardized wet-lab workflows, transparent QC criteria, and reanalysis-ready deliverables when evaluating external support. CD Genomics presents its cfDNA methylation sequencing and analysis in this RUO framework, with attention to sample handling, sequencing workflow, and downstream analysis support rather than diagnostic use.
Key Pitfalls in Cell-of-Origin Interpretation
Low-abundance contributors may not be stable
Signals near the detection limit are vulnerable to sampling variance and coverage fluctuations. If a rare contributor appears only in a subset of replicates or shows inconsistent directionality, treat it as exploratory and seek orthogonal evidence before elevating its significance. Ask yourself: if this contributor were real, would an orthogonal assay or an additional time point show the same direction and magnitude?
Similar tissues may blur together
Closely related tissues or subtypes that lack strong atlas contrast will partially merge in the model's estimates. This is expected behavior, not a failure of the method. Frame your questions around separations that the atlas can plausibly resolve. When in doubt, could a simpler broad-class framing answer the biological question more reliably?
Batch effects and pre-analytical drift can mimic biology
Tube differences, processing delays, or library preparation batches may produce structure that looks biological. Track batches, standardize handling, randomize within sequencing runs, and test for batch associations before interpreting group differences.
A Practical Workflow for Planning the Project
Step 1. Define the biological question
Write down the hypothesis as a proportion shift you aim to detect at the level of broad tissue classes. If applicable, specify expected directionality and magnitude and list plausible confounders.
Step 2. Confirm sample feasibility
Inventory available samples, inputs, and storage conditions. Decide whether you can keep tube type, draw-to-spin windows, and storage consistent within cohorts. If feasibility is marginal, consider a pilot to calibrate feature coverage and noise.
Step 3. Match the assay to the study goal
Choose conversion or enrichment chemistries that align with input realities and desired feature space. Enzymatic conversion can preserve DNA at very low input; bisulfite-based WGBS/RRBS provide comprehensive or focused coverage when inputs and depth suffice. Ensure the downstream deconvolution approach expects and uses the features your assay will produce. For a primer on 5mC versus 5hmC modalities that sometimes inform assay choices, see this short explainer from CD Genomics on detection methods (5mC and 5hmC detection methods explainer).
Step 4. Select a reference and analysis framework
Pick an atlas that covers your expected contributors and matches your chemistry and depth. If gaps are likely, adopt a framework that can tolerate unknowns and predefine language for uncertain attributions. Choose feature selection strategies that ensure robust coverage at your planned depth. For broader method context and benchmarking across deconvolution frameworks, consult recent evaluations (Systematic evaluation 2024).
Step 5. Predefine interpretation boundaries
Before sequencing, write the boundaries you will respect: what constitutes supportive evidence, what remains exploratory, what phrasing you'll use for uncertain or low-abundance findings, and what orthogonal data you'll seek for confirmation.
 A well-scoped cell-of-origin project begins with a defined biological question, feasible samples, and realistic interpretation boundaries.
What to Ask for in the Final Deliverables
Your goal is to receive evidence you can audit and reuse. Ask for reanalysis-ready files, transparent QC, and clear documentation.
Essential technical outputs
Request a concise QC summary covering library and sequencing metrics, contamination risk from leukocyte gDNA, internal controls and normalization if used, and cross-batch comparability checks. You should also obtain aligned reads with indexes and versioned notes on the pipeline.
Essential biological outputs
Ask for deconvolution tables with estimated tissue proportions and any available confidence measures, summary visualizations for group contrasts, and short narrative notes that map results back to your predefined biological question and boundaries.
Files that support re-analysis
At minimum, request signal tracks and tables appropriate to your assay—such as bigWig or bedGraph for methylation and coverage, region or DMR tables with effect sizes, and the deconvolution input matrix alongside model parameters and software versions.
FAQs About cfDNA Cell-of-Origin Analysis
1. How accurate is cell-of-origin analysis in cfDNA methylation studies?
Accuracy is highest for detecting relative differences across broad tissue classes when the reference atlas is well matched and pre-analytics are controlled. Supervised models that leverage broad atlases have outperformed certain baselines in published benchmarks (PNAS 2023), and read-level strategies have improved sensitivity to subtle contributors in simulations and several real-world tests reported by their authors (NAR Genomics and Bioinformatics 2023). Accuracy declines when depth is low, features are poorly covered, or the atlas lacks relevant tissues. Integrating complementary fragmentomics signals may help in some low-input contexts (PNAS 2022).
2. Can cfDNA methylation distinguish closely related tissues or cell types?
Sometimes, but this is a common limitation. The ability to resolve close neighbors depends on the contrast captured in the atlas and the quality and coverage of selected features. Region-level markers can help stabilize signals, and read-level models can add sensitivity; however, predefined boundaries and cautious phrasing remain essential when separations are marginal. Comparative assessments discuss where discrimination tends to hold vs struggle (Systematic assessment 2022).
3. How much cfDNA input is usually needed for tissue-of-origin analysis?
Inputs vary by assay and platform. Enzymatic conversion chemistries often preserve DNA and broaden coverage at low input, while bisulfite-based approaches provide comprehensive or focused coverage when inputs and depth are sufficient. Rather than a single threshold, plan feasibility ranges, replicate strategies, and coverage checks for your informative features, then commit to re-run rules if QC gates are missed. For a high-level overview of chemistry trade-offs, see a recent comparative review (Briefings in Bioinformatics 2024).
4. Does sample type or pre-analytical handling affect cell-of-origin results?
Yes. Tube type, processing delays, storage, and freeze-thaw cycles affect cfDNA integrity and leukocyte gDNA contamination risk, which in turn influence methylation profiles and deconvolution outputs. Choose handling SOPs that you can keep consistent within cohorts and document them so any residual variance is visible and testable (PMC 2023 evaluation; Harmonization guidance 2020).
5. What is the biggest reason cell-of-origin interpretation fails?
Projects most often falter because the reference atlas does not reflect the biology in the cohort, or because feature coverage is too sparse to support stable estimates—often due to low input and insufficient depth. Pre-analytical and batch differences that align with cohorts are another frequent cause, creating apparent biology that disappears when handling is standardized. Methods that model unknown components can mitigate, but not fully remove, attribution errors when the atlas is incomplete (Bioinformatics 2024).
How to Decide Whether Your Project Is Ready
Your project is likely ready if
Your biological question is framed as a broad tissue-level proportion inference; sample handling can be made consistent within cohorts; estimated inputs and depth will cover your informative features; and your reference atlas matches expected contributors.
You may need to refine the design first if
The signal you seek sits among very similar tissues with weak contrast; samples come from mixed handling SOPs that you cannot standardize; inputs are too low to meet your coverage plan without replicates; or your atlas lacks key tissues or states.
Next step for planning
Write a one-page design memo covering your biological question, sample feasibility, assay fit, reference atlas choice, feature strategy, and interpretation boundaries. Use it to align your team and vendors before you commit to sequencing so that proportion estimates and their limits are interpretable on delivery.
References
- cfSort — supervised tissue methylation atlas and deconvolution framework (PNAS, 2023).
- CelFEER — read-level sensitivity analyses for cfDNA mixture deconvolution (NAR Genomics and Bioinformatics, 2023).
- MetDecode — modeling unknown components under noise and atlas gaps (Bioinformatics, 2024).
- Fragmentomics-based methylation inference — cleavage-profile and motif-end ratio proxies that track methylation in plasma (PNAS, 2022).
- Systematic evaluation of methylation-based deconvolution methods (2024).
- Systematic assessment of deconvolution strategies and marker selection (2022).
- Pre-analytical evaluation of preservative blood collection tubes for cfDNA workflows (2023).
- Harmonization guidance for cfDNA collection and processing (2020).