Mapping the 3D Genome: A Researcher's Guide to the 3C Technology Family
At a glance:
- Introduction: The Architecture of the Genome
- The Foundational Technique: Principles of Chromosome Conformation Capture (3C)
- The Evolution of Scope: From Targeted Queries to Genome-Wide Maps
- Service you may intersted in
- Targeted Interrogation: A Deep Dive into 4C and 5C
- The Genome-Wide Revolution: Hi-C and its Discoveries
- Expanding the Toolkit: Derivative and Multi-omic Methods
- Choosing the Right Tool: A Practical Comparison
- From Data to Discovery: An Overview of the Bioinformatics Workflow
- Conclusion: The Future is Four-Dimensional
- Summary
- Frequently Asked Questions (FAQ)
Introduction: The Architecture of the Genome
The Packaging Paradox: From Linear Sequence to Functional Structure
The genome of a eukaryotic cell presents a profound paradox of scale. The human genome, for instance, comprises approximately two meters of DNA, which must be efficiently compacted into a nucleus that is often less than 10 micrometers in diameter—a feat analogous to packing 40 kilometers of fine thread into a tennis ball.1 For decades, our understanding of the genome was largely confined to its one-dimensional sequence of nucleotides. However, it is now unequivocally clear that the process of compaction is not a random entanglement. Instead, it is a highly sophisticated and dynamic architectural process, essential for the very function of the cell.1 Each cell must constantly negotiate a dynamic equilibrium between the demand for extreme packaging and the critical need to access its genetic information for fundamental processes such as gene expression, DNA replication, and repair.1
Introducing the 3D Genome: A New Frontier in Gene Regulation
The solution to this packaging paradox lies in the three-dimensional (3D) organization of the genome. Rather than a simple linear code, the genome exists as a functional, folded landscape. This landscape is organized hierarchically, beginning with the confinement of individual chromosomes into distinct nuclear volumes known as chromosome territories.3 Within these territories, the chromatin is further segregated into large-scale active ('A') and inactive ('B') compartments.5 At a finer resolution, these compartments are built from smaller, self-interacting regulatory units called Topologically Associating Domains (TADs), which in turn are shaped by specific, point-to-point chromatin loops.2 This intricate architecture is far from static or merely structural; it represents a critical layer of gene regulation. By folding in three dimensions, the genome can bring distant regulatory elements, such as enhancers and silencers, into direct physical contact with their target gene promoters, an act that is fundamental to controlling gene expression.4 The realization that a thorough understanding of genome function is impossible without a corresponding understanding of its spatial organization has launched a new era in genomics.9
When Architecture Fails: The Role of 3D Genomics in Disease
The functional importance of the 3D genome is starkly illustrated when its architecture is compromised. A growing body of evidence now links disruptions in this complex folding to a wide spectrum of human diseases, from developmental disorders to cancer.6 Chromosomal rearrangements, a hallmark of many cancers, do more than simply alter the linear sequence; they can catastrophically rewire the 3D landscape. For example, the translocation of a potent enhancer near a proto-oncogene, or the breakdown of a TAD boundary that normally insulates an oncogene from activating elements, can lead to aberrant gene expression and drive tumorigenesis.11 Consequently, mapping the 3D genome provides invaluable insights into the structural and functional basis of disease, uncovering novel mechanisms of pathogenesis.11
The C-Series Toolkit: A Revolution in Visualizing the Invisible
For much of the history of molecular biology, the 3D genome remained largely invisible, accessible only through the low-resolution lens of microscopy, which lacked sequence-specific detail.1 This changed dramatically with the development of Chromosome Conformation Capture (3C) and its derivatives—a family of technologies that has collectively been the driving force behind the 3D genomics revolution.1 First described in 2002, the foundational 3C method provided a powerful new logic: converting the transient, physical proximity of genomic loci into stable, quantifiable DNA ligation products.9 This conceptual leap bridged the gap between physical structure and genetic sequence, allowing researchers, for the first time, to create high-resolution maps of the folded genome.9 The evolution of this toolkit, from the targeted queries of 3C to the genome-wide vistas of Hi-C, has transformed our view of the genome from a static blueprint to a dynamic, four-dimensional entity.
The Foundational Technique: Principles of Chromosome Conformation Capture (3C)
The Core Logic: Converting 3D Proximity into a Detectable Signal
At the heart of the entire C-series of technologies is the elegant and powerful principle of the original 3C protocol.14 The method was devised to answer a seemingly simple question: do two genomic regions that are distant in the linear sequence physically interact within the 3D space of the nucleus? The protocol's genius lies in its method of converting a biophysical property—spatial proximity—into a genetic one: a novel, artificial DNA sequence at a ligation junction that can be detected and quantified.16 This conversion creates a permanent, linear record of a transient 3D interaction, forming the basis upon which all subsequent, higher-throughput methods are built.
A Step-by-Step Breakdown of the 3C Workflow
The 3C protocol is a multi-step biochemical procedure that requires careful execution at each stage. Though variations exist, the core workflow remains consistent and provides the foundational template for its more complex derivatives.
- In Vivo Cross-linking: The process begins with intact, living cells. A cross-linking agent, most commonly formaldehyde, is added directly to the cell culture medium.11 Formaldehyde permeates the cell and nuclear membranes, creating covalent protein-DNA and protein-protein cross-links. This step is akin to taking a high-resolution snapshot, effectively "freezing" the chromatin in its native 3D conformation and preserving the spatial relationships between all genomic elements.18 Careful standardization of this step is critical, as over-cross-linking can create large, insoluble protein-DNA aggregates that are resistant to subsequent enzymatic digestion, thereby reducing the efficiency of the entire protocol.10
- Chromatin Fragmentation: Following cross-linking, the cells are lysed, and the nuclei are isolated. The cross-linked chromatin is then digested with a restriction enzyme, such as HindIII or EcoRI.14 This enzyme cuts the DNA at specific, predictable recognition sites, generating a complex library of chromatin fragments. Crucially, fragments that were spatially proximal in the nucleus remain physically tethered together by the network of cross-linked protein complexes.
- Chromatin Interaction Linking: This is the conceptual and technical core of the 3C method. The mixture of cross-linked, digested chromatin fragments is subjected to ligation with DNA ligase under conditions of extreme dilution.16 The high volume of the reaction mixture ensures that the concentration of chromatin complexes is very low. Under these conditions, the probability of two fragments from different complexes randomly colliding and being ligated (intermolecular ligation) is minimized. Instead, the reaction strongly favors ligation between fragments that are already held in close proximity within the same cross-linked complex (intramolecular ligation).16 This step is what selectively captures true 3D interactions, creating novel, chimeric DNA molecules where the junction represents a point of spatial contact in the original nucleus.
- Analysis and Quantification: After ligation, the cross-links are reversed, typically by heat and treatment with proteinase K, which degrades the proteins and releases the DNA.15 The resulting DNA library contains a mixture of re-ligated original fragments and the chimeric ligation products of interest. The original 3C protocol uses quantitative PCR (qPCR) with a pair of primers designed to specifically amplify the junction between two predetermined genomic loci.11 The amount of PCR product generated is then measured, providing a quantitative readout that is directly proportional to the frequency with which those two loci interacted in the original cell population.15
Challenges and Considerations
While conceptually elegant, the 3C protocol is technically demanding. It is a long and complex procedure where a mistake made at an early stage, such as incomplete digestion or inefficient ligation, may only become apparent at the final qPCR step, resulting in a failed experiment.21 Furthermore, the primary limitation of the original 3C method is its inherently low throughput. It is a hypothesis-testing tool, capable of interrogating only one specific interaction between one pair of known loci at a time—a "one-vs-one" approach.11 This makes it unsuitable for discovery-based research or for mapping complex interaction networks. It was precisely this limitation that spurred the development of the more advanced C-series technologies.
The Evolution of Scope: From Targeted Queries to Genome-Wide Maps
Answering Bigger Questions
The success of the 3C method in confirming specific, hypothesized chromatin loops immediately gave rise to a new set of more ambitious scientific questions.1 Validating a single interaction was a landmark achievement, but it naturally led researchers to ask: "If this enhancer interacts with this promoter, what else does it interact with?" and, more broadly, "What does the complete interaction landscape of an entire chromosome, or even the entire genome, look like?" The evolution of the C-method family was not merely a series of technical refinements; it was a direct response to the expanding scope of scientific inquiry, a progression from hypothesis testing to unbiased discovery and finally to systems-level analysis.1 This evolution was driven by the dual forces of scientific curiosity and enabling technological advancements, most notably the advent of next-generation sequencing (NGS).
A Clear Classification Framework
To navigate the growing family of C-methods, a simple yet powerful classification system has emerged based on the scope of the interactions being interrogated. This framework provides an intuitive mental model for understanding the purpose and application of each technique and is consistently used throughout the literature.10 The progression reflects a logical expansion of experimental scale, moving from the specific to the comprehensive.
- 3C: One-vs-One. This is the foundational, hypothesis-driven method. It is designed to test a single, specific interaction between two a priori known genomic loci. An example would be using a specific primer pair to confirm a predicted interaction between a known enhancer and its putative target gene promoter.11
- 4C: One-vs-All. This is the first step toward unbiased discovery. 4C technology is designed to take a single known locus of interest, referred to as the "bait" or "viewpoint," and identify all of its interacting partners across the entire genome. This approach does not require any prior knowledge of the potential interaction partners, making it a powerful tool for discovery.11
- 5C: Many-vs-Many. This method increases throughput for regional analysis. 5C technology simultaneously maps the complete network of interactions among many loci within a large, contiguous genomic region, typically spanning hundreds of kilobases to several megabases. It is ideal for creating a comprehensive interaction matrix of a complex locus.11
- Hi-C: All-vs-All. Representing the ultimate expansion of the 3C concept, Hi-C is designed to be a completely unbiased, genome-wide method. It captures a global snapshot of all possible pairwise chromatin interactions across the entire nucleus, providing a comprehensive, "all-vs-all" view of 3D genome architecture.11
This evolutionary trajectory from 3C to Hi-C perfectly mirrors the scientific process itself. A specific, targeted observation made with 3C (e.g., "this loop exists") led to a broader, discovery-oriented question that 4C was designed to answer (e.g., "what other loops does this locus form?"). The need to understand complex regional "wiring diagrams" in a high-throughput manner, which was inefficient with 4C, drove the development of 5C. Finally, the maturation of NGS technology made the technically and financially daunting "all-vs-all" experiment of Hi-C a reality, enabling a systems-level view of the entire genome's organization.
Service you may intersted in
 Figure 1: Overview of 3C-Based Methods (Image from: Liu, G., & Wang, K. (2018). Chromosome conformation capture (3C) and 3C-based technologies. In Encyclopedia of Big Data Technologies. )
The diagram shows the common initial steps for all methods: formaldehyde cross-linking, restriction digestion, and Chromatin Interaction Linking to create a 3C library. It then branches to show the unique steps for each technique.
3C: Uses specific PCR primers to detect an interaction between two known fragments.
4C: Employs a second digestion and circularization, followed by inverse PCR from a known "bait" fragment to identify all its interaction partners.
5C: Uses a multiplexed ligation-mediated amplification with universal primers to detect all interactions within a large, defined region.
Hi-C: Incorporates biotin-labeled nucleotides during the fill-in step, allowing for the enrichment of ligation junctions and subsequent genome-wide sequencing.
Targeted Interrogation: A Deep Dive into 4C and 5C
While Hi-C provides a global perspective, the 4C and 5C techniques represent two distinct and powerful evolutionary branches from the original 3C method. They are not merely obsolete predecessors to Hi-C but remain highly relevant, cost-effective tools optimized for specific, high-resolution, hypothesis-driven research questions. They fill a crucial niche by providing deep, targeted data at a fraction of the cost required to achieve similar resolution with genome-wide methods.
4C (Chromosome Conformation Capture-on-Chip/Circular): The "Viewpoint" Analysis
The 4C technique was developed to overcome the primary limitation of 3C by enabling an unbiased, genome-wide search for all sequences interacting with a single locus of interest—the "bait."
- Protocol Explained: The 4C workflow begins with the generation of a standard 3C library. The key innovation occurs after the first Chromatin Interaction Linking step. The DNA is purified and then subjected to a second digestion with a different, more frequently cutting restriction enzyme.25 This creates smaller fragments that are then ligated again under dilute conditions designed to promote self-circularization.27 The result is a library of small, circular DNA molecules, where each circle ideally contains the known "bait" fragment ligated to a previously unknown interacting "prey" fragment. To identify these prey fragments, inverse PCR is performed using primers that are designed to bind to the bait sequence and amplify outwards, across the ligation junction and into the unknown sequence.27 The resulting library of amplified prey fragments can then be identified and quantified, originally by hybridization to a microarray (hence "on-chip") or, more commonly in the modern iteration known as 4C-seq, by high-throughput sequencing.25
- Primary Applications: The principal application of 4C-seq is to generate a high-resolution, one-dimensional interaction profile that maps the entire regulatory interactome of a single viewpoint.29 This makes it an invaluable tool for discovering novel long-range enhancers that regulate a gene of interest, for identifying the target genes of non-coding disease-associated SNPs, or for characterizing how the nuclear environment of a specific locus changes during cellular differentiation or in response to stimuli.28 For example, 4C-seq has been instrumental in mapping the complex interaction landscapes of oncogene enhancers, revealing how they hijack regulatory control over distant genes in cancer cells.28
5C (Chromosome Conformation Capture Carbon Copy): High-Throughput Regional Mapping
The 5C technique was developed to address a different challenge: the need to simultaneously and quantitatively map a complex web of interactions between many elements within a large, defined genomic region.
- Protocol Explained: Like 4C, the 5C method begins with a conventional 3C library. Its unique feature is a highly multiplexed detection step called Ligation-Mediated Amplification (LMA).33 Instead of using one pair of primers, a large pool of thousands of forward and reverse 5C primers is designed. Each forward primer corresponds to the 3' end of one restriction fragment in the region of interest, and each reverse primer corresponds to the 3' end of another. These primers are annealed to the 3C library. A ligation event can only occur if a forward primer and a reverse primer anneal directly adjacent to each other on a 3C ligation product, effectively "copying" the junction.33 All primers are designed with universal tails, allowing the entire library of ligated primer pairs to be amplified in a single PCR reaction. This library is then sequenced, and the abundance of each unique forward-reverse primer pair provides a quantitative measure of the interaction frequency between the two corresponding restriction fragments.33
- Primary Applications: 5C is the method of choice for generating a comprehensive, high-resolution interaction matrix for a specific genomic region, typically up to several megabases in size.11 It is perfectly suited for dissecting the intricate regulatory architecture of classic developmental loci like the human β-globin locus or the Hox gene clusters, where numerous enhancers, promoters, silencers, and insulators engage in a complex and dynamic network of interactions.33 By providing a "many-vs-many" view, 5C allows researchers to map entire gene regulatory networks and higher-order chromatin folding patterns within a defined domain of interest.20
The Genome-Wide Revolution: Hi-C and its Discoveries
The development of Hi-C marked a transformative moment in genomics, moving beyond the targeted views of its predecessors to provide the first truly global, unbiased maps of 3D genome architecture. This "all-vs-all" approach was made possible by a key technical innovation and the concurrent rise of massively parallel sequencing, and the data it generated revealed a stunningly complex and hierarchical set of organizational principles that govern how genomes are folded and function.
The Hi-C Protocol: An Unbiased "All-vs-All" View of the Interactome
The Hi-C protocol builds upon the 3C foundation but introduces a critical modification that enables genome-wide analysis with high efficiency.
- The Biotin Innovation: The defining feature of the Hi-C method is the incorporation of a biotinylated nucleotide during the protocol.14 After the initial restriction digest, the 5' overhangs (or "sticky ends") of the DNA fragments are filled in by a DNA polymerase. The nucleotide mixture used for this fill-in reaction includes one nucleotide (e.g., dCTP) that is covalently linked to a biotin molecule.10 Following this labeling step, the blunt-ended fragments undergo Chromatin Interaction Linking as in the 3C protocol. The ligated DNA is then purified and sheared into smaller fragments suitable for sequencing. At this stage, only the DNA fragments that represent a true Chromatin Interaction Linking event—chimeric molecules formed from two different original fragments—will contain an internal biotin label at their junction. Using streptavidin-coated magnetic beads, which have a very high affinity for biotin, these junction-containing fragments can be specifically pulled down and enriched from the rest of the genomic DNA.10 This enrichment step is paramount; it dramatically increases the proportion of informative reads in the final sequencing library, making a cost-effective, genome-wide analysis feasible.14
- In Situ Hi-C: A significant refinement to the original Hi-C protocol was the development of in situ Hi-C, where the key steps of digestion and ligation are performed within intact, permeabilized nuclei rather than in a dilute solution.36 By keeping the chromatin confined within the nucleus, this approach better preserves the native chromatin structure and significantly reduces the rate of spurious, random ligations. This results in cleaner data with a much higher signal-to-noise ratio, enabling the generation of higher-resolution interaction maps.36
Landmark Discoveries Enabled by Hi-C: Unveiling the Rules of Genome Folding
The unbiased, genome-wide nature of Hi-C data allowed researchers to observe emergent patterns of genome organization at multiple scales. These observations were not confirming pre-existing hypotheses; they were true discoveries that revealed a previously unknown "grammar" of genome folding.
- A/B Compartments: One of the first and most striking features observed in Hi-C maps was a large-scale, checkerboard pattern of interactions.5 This pattern revealed that the entire genome is segregated into two major spatial compartments. The 'A' compartment is generally associated with open, gene-rich, and transcriptionally active chromatin (euchromatin). The 'B' compartment is associated with dense, gene-poor, and transcriptionally silent chromatin (heterochromatin), often located at the nuclear periphery.5 Hi-C data showed a strong preference for loci within the A compartment to interact with other A compartment loci, and for B to interact with B, even across different chromosomes. This demonstrated a fundamental principle of nuclear organization: the physical segregation of active and inactive domains.5
- Topologically Associating Domains (TADs): At the sub-megabase scale, Hi-C maps revealed that chromosomes are partitioned into discrete, self-interacting domains that appear as distinct squares along the diagonal of the contact matrix. These were named Topologically Associating Domains, or TADs.5 DNA within a given TAD interacts much more frequently with other sequences inside the same TAD than it does with sequences in neighboring TADs.3 The boundaries between TADs act as insulators, constraining the action of regulatory elements like enhancers to their own domain. TADs are now considered fundamental, evolutionarily conserved building blocks of chromosome architecture that form insulated regulatory neighborhoods, thereby bringing order to the complex process of gene regulation.4
- Chromatin Loops: At the highest resolution, Hi-C data can resolve specific, point-to-point interactions that appear as focal points of high contact frequency on the map. These are known as chromatin loops.5 These loops often represent the physical tethering of distal enhancers to their target gene promoters, providing the structural basis for long-range gene activation.18 A significant portion of these loops, particularly those that define the corners of TADs, are anchored by binding sites for the architectural protein CTCF and are stabilized by the cohesin ring complex. This has led to the "loop extrusion" model, which posits that cohesin actively extrudes loops of chromatin until it is blocked by convergently oriented CTCF sites, thereby forming the stable structure of a TAD.4
Aiding Genome Assembly
Beyond revealing the principles of genome folding, Hi-C has become an indispensable tool for a more foundational task in genomics: genome assembly. The process of assembling a complete genome from short sequencing reads often results in a fragmented collection of sequences called contigs. Hi-C provides the long-range information necessary to order and orient these contigs into chromosome-length scaffolds. The underlying principle is that the frequency of interaction between two genomic regions is inversely proportional to their linear distance. Therefore, by analyzing the Hi-C contact map, bioinformatic algorithms can determine which contigs are physically close to each other, arranging them into a linear order that reflects their true chromosomal arrangement.14 This application has been critical in producing high-quality, reference-grade genome assemblies for a wide range of species.
Expanding the Toolkit: Derivative and Multi-omic Methods
The core C-methods have been ingeniously combined with other molecular biology techniques to answer more specific questions, adding layers of functional information to the structural maps. These derivative methods allow researchers to investigate interactions mediated by specific proteins or to focus sequencing power on particular regions of interest.
Immunoprecipitation-Based Methods
These techniques integrate Chromatin Immunoprecipitation (ChIP) to isolate interactions associated with a specific protein of interest, such as a transcription factor or a component of the cohesin complex.
- ChIP-Loop: This method combines ChIP with the original 3C protocol. It is used to test whether a specific protein mediates a hypothesized interaction between two known loci. By first enriching for chromatin bound by the target protein, it reduces background noise and increases the specificity of the 3C assay.3
- ChIA-PET (Chromatin Interaction Analysis by Paired-End Tagging): As a genome-wide extension of ChIP-Loop, ChIA-PET combines ChIP with a Hi-C-like workflow to map all interactions across the genome that are mediated by a specific protein.1 This provides a global view of the protein-centric interactome, revealing the complete network of contacts established by factors like CTCF or RNA Polymerase II.
- HiChIP: This technique refines the ChIA-PET approach by combining an in-situ Hi-C workflow with a ChIP step and using the Tn5 transposase for efficient library preparation. HiChIP significantly reduces the required starting cell number and increases the yield of informative reads compared to ChIA-PET, making it a more sensitive and efficient method for mapping protein-directed chromatin contacts.4
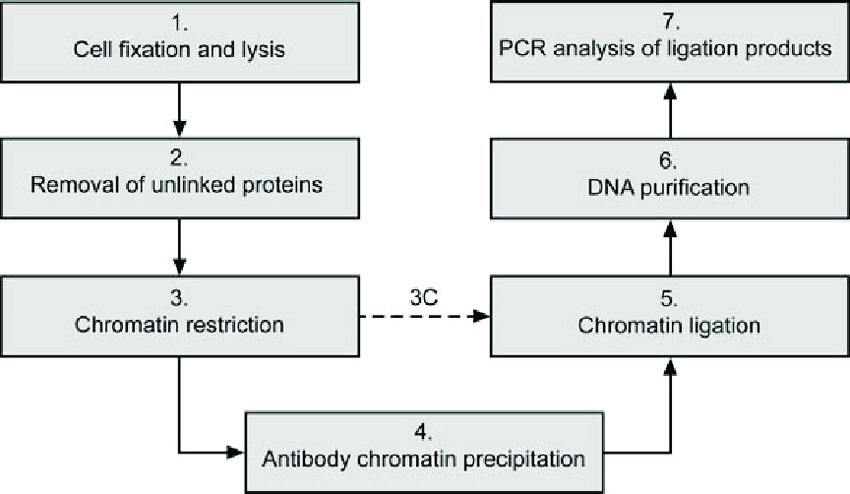 Figure 2: Workflow of the ChIP-Loop Assay. (Image from: Gavrilov, A., Eivazova, E. R., Pirozhkova, I. V., Lipinski, M., Razin, S. V., & Vassetzky, Y. (2009). Chromosome conformation capture (from 3C to 5C) and its ChIP-based modification. Methods in Molecular Biology, 567, 171-188.)
The schematic shows the key steps of the ChIP-Loop protocol:
Chromatin is cross-linked with formaldehyde.
The chromatin is fragmented using a restriction enzyme.
An antibody specific to a target protein is used to immunoprecipitate the protein-DNA complexes. This step enriches for interactions mediated by that specific protein.
Chromatin Interaction Linking is performed on the enriched complexes.
Cross-links are reversed, and the resulting DNA is analyzed by qPCR to detect the specific interaction of interest. The diagram notes that in a standard 3C analysis, the antibody precipitation step is omitted.
Hybridization-Based Methods
These methods use oligonucleotide capture probes to enrich a 3C or Hi-C library for specific regions of interest before sequencing. This focuses sequencing depth on targeted loci, enabling very high-resolution analysis in a cost-effective manner.
- Capture-C: This technique combines a 3C library with oligonucleotide capture technology (OCT). Biotinylated probes are used to pull down specific viewpoints (e.g., gene promoters) and their ligated partners from the library. This allows for an unbiased, high-resolution view of all interactions involving hundreds of specific loci in a single experiment.3
- Capture Hi-C: This method applies the same capture principle to a Hi-C library. It enriches for all interactions involving a set of pre-defined regions of interest on a genome-wide scale. This is particularly powerful for linking disease-associated non-coding variants to their distal target genes across the entire genome.5
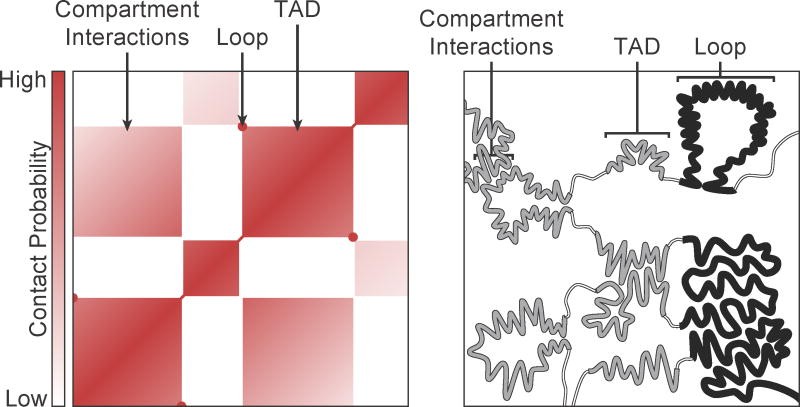 Figure 3: A Hi-C Contact Map Showing Key Architectural Features.(Image from: Rowley, M. J., & Corces, V. G. (2018). Organizational principles of 3D genome architecture. Nature Reviews Genetics, 19(12), 789-800.)
The image displays a heatmap where the color intensity of each pixel represents the interaction frequency between
two genomic regions. Key features are annotated:
A/B Compartments: A large-scale checkerboard pattern is visible, representing the segregation of active (A) and inactive (B) chromatin.
Topologically Associating Domains (TADs): These appear as distinct squares of high interaction frequency along the diagonal of the map, representing self-interacting chromatin domains.
Choosing the Right Tool: A Practical Comparison
Matching the Method to the Question
The evolution of the C-series technologies has provided researchers with a powerful and versatile toolkit. However, the diversity of these methods means that selecting the appropriate technique is a critical step in experimental design. The optimal choice depends on a careful consideration of the specific biological question, the required resolution, the scope of the analysis, and practical constraints such as cost and available cell numbers. The following framework provides guidance for common research scenarios:
- For hypothesis validation, where a researcher has a strong prediction about an interaction between two specific loci (e.g., from computational modeling or complementary epigenetic data), the original 3C method remains the most direct, efficient, and cost-effective tool. Its "one-vs-one" nature is perfectly suited for confirming a single, targeted interaction via qPCR.11
- For unbiased discovery from a single locus, where the goal is to identify all the unknown regulatory elements that communicate with a specific gene of interest, 4C-seq is the ideal choice. Its "one-vs-all" approach provides a high-resolution interaction profile for a single "viewpoint," making it powerful for mapping the complete regulatory landscape of a target gene or a non-coding SNP.25
- For comprehensive regional mapping, such as dissecting the complex regulatory architecture of a multi-gene locus implicated in development or disease, 5C is the most appropriate method. Its "many-vs-many" capability allows for the generation of a detailed interaction matrix for a specific region of up to several megabases, revealing the entire network of internal contacts.11
- For global, systems-level analysis, where the objective is to understand genome-wide changes in chromatin architecture—for example, comparing TAD structures between healthy and cancerous cells, or assessing the global impact of a drug on chromosome folding—Hi-C is the essential tool. Its "all-vs-all" scope is the only approach that provides the necessary unbiased, genome-wide view.11
- For mapping protein-mediated interactions, where the question centers on the architectural role of a specific protein, ChIA-PET or the more sensitive HiChIP are the methods of choice. They provide a genome-wide map of the contacts specifically associated with the target protein.1
- For high-resolution analysis of many specific loci, such as mapping the promoter interactomes of hundreds of candidate genes simultaneously, Capture-C or Capture Hi-C offer a cost-effective solution by focusing sequencing power on regions of interest.3
The Central Comparative Table
To facilitate this decision-making process, the key features, advantages, and limitations of each major C-series technology are summarized below. This table serves as a quick-reference guide for researchers and CRO clients to align their experimental goals with the most suitable method.
| Feature | 3C (Chromosome Conformation Capture) | 4C-seq (Circular 3C-Sequencing) | 5C (3C-Carbon Copy) | Hi-C | ChIA-PET / HiChIP | Capture-C / Capture Hi-C |
| Scope | One-vs-One | One-vs-All | Many-vs-Many | All-vs-All | Protein-centric All-vs-All | Many-vs-All (Targeted Enrichment) |
| Primary Output | Interaction frequency via qPCR | Interaction profile of a single "viewpoint" | Interaction matrix for a defined region | Genome-wide contact matrix | Genome-wide contact matrix for a specific protein | High-resolution interaction profiles for hundreds of viewpoints |
| Resolution | High (primer/fragment dependent) 22 | High for viewpoint interactions (restriction fragment level) | High within the target region (restriction fragment level) | Variable; dependent on sequencing depth (typically 5 kb - 40 kb) | Variable; dependent on sequencing depth | Very High (restriction fragment level) 5 |
| Throughput | Very Low | Medium | High | Very High (Genome-wide) | Very High (Genome-wide) | High (Multiplexed) |
| Key Advantage | Simple, targeted, and cost-effective for validation | Unbiased discovery of all partners for a single locus of interest | Comprehensive and quantitative mapping of a complex regional network | Unbiased, genome-wide view of chromatin architecture; enables discovery of global principles | Identifies interactions mediated by a specific protein of interest | Extremely high resolution and sensitivity for targeted loci; cost-effective |
| Key Limitation | Requires a priori knowledge of both interacting loci; very low throughput | Signal is biased towards regions proximal to the viewpoint; can have high background noise | Complex and costly primer design; limited to pre-defined regions of the genome | Requires massive sequencing depth for high resolution; high cost and complex data analysis | Requires a high-quality antibody; data is limited to sites bound by the target protein | Requires design of capture probes; not a genome-wide discovery tool |
| Typical Use Case | Validate a predicted enhancer-promoter interaction. | Identify all enhancers that regulate a specific oncogene. | Map the complete interaction architecture of the Hox gene cluster during development. | Compare global TAD and compartment structures between different cell types or disease states. | Map all CTCF-mediated loops in the genome. | Map all promoter-enhancer interactions for a panel of 500 genes. |
From Data to Discovery: An Overview of the Bioinformatics Workflow
The Data Challenge
The generation of high-throughput sequencing data via methods like 4C-seq, 5C, and especially Hi-C, marks only the beginning of a 3D genomics experiment. The resulting datasets are massive and complex, presenting substantial analytical challenges that require a specialized and robust bioinformatics pipeline.43 For any laboratory or CRO client embarking on such a project, understanding and planning for the computational analysis is as critical as the wet-lab protocol itself. Failure to do so can lead to an inability to extract meaningful biological insights from a costly and labor-intensive experiment.
Core Steps in the Hi-C Analysis Pipeline
While specific tools and algorithms may vary, the bioinformatics workflow for processing Hi-C data follows a conserved set of core steps designed to convert raw sequencing reads into an interpretable map of chromatin interactions.
- Read Mapping: The process begins with the raw paired-end sequencing reads. Each read in a pair is mapped independently to a reference genome. This independent mapping is crucial because, by the nature of the Hi-C experiment, the two reads of a valid pair are expected to originate from genomic loci that may be separated by millions of bases or even reside on different chromosomes.17 Standard paired-end aligners are often insufficient, and specialized tools or strategies are required to handle these "chimeric" alignments effectively.26
- Filtering and Quality Control: The raw mapped reads contain a significant number of products that are experimental artifacts and do not represent true chromatin interactions. Therefore, a rigorous filtering pipeline is applied to remove these uninformative reads. Common artifacts include PCR duplicates (multiple identical read pairs arising from amplification of a single original molecule), unligated or self-ligated DNA fragments, and reads that map to the same restriction fragment.17 Only the valid, unique read pairs that span a ligation junction between two different restriction fragments are retained for downstream analysis.
- Binning and Contact Matrix Generation: To manage the data and increase the signal-to-noise ratio, the genome is computationally divided into non-overlapping bins of a fixed size (e.g., 10 kb, 40 kb, or 1 Mb).14 The filtered, valid interaction pairs are then used to populate a large, square, symmetrical matrix. In this contact matrix, both the rows and columns represent the genomic bins, and the value in each cell (i, j) corresponds to the number of read pairs detected that link bin i with bin j.14 This matrix is the fundamental data structure for all subsequent Hi-C analysis.
- Normalization: A raw contact matrix is subject to numerous sources of systematic bias that can obscure the true interaction patterns. For example, some genomic regions are more easily mappable, have higher GC content, or are located on longer restriction fragments, all of which can artificially inflate their apparent contact frequencies. Normalization is a critical computational step to correct for these biases.14 Algorithms such as Iterative Correction and Eigenvector decomposition (ICE) are widely used. These methods operate on the assumption that, in a perfectly unbiased experiment, every genomic region should have an equal probability of being detected (equal "visibility"). The algorithm iteratively adjusts the matrix values until each row and column sums to a constant value, resulting in a "balanced" matrix that more accurately reflects the underlying contact biology.11
The Relationship Between Sequencing Depth and Resolution
A crucial concept that researchers must grasp is that the "resolution" of a Hi-C experiment is not an intrinsic property of the technique itself. Rather, it is an emergent feature determined by the interplay between the frequency of restriction enzyme cutting, the total number of valid sequencing reads obtained (sequencing depth), and the chosen bin size for analysis. The fundamental trade-off is that achieving higher resolution (i.e., using smaller bin sizes to see finer details) requires a dramatically, often exponentially, greater amount of sequencing data and, consequently, a higher cost.14 For example, a Hi-C dataset for the human genome with approximately 100 million valid read pairs is generally considered sufficient to generate a reliable contact map at a 40 kb resolution. However, to move to a 10 kb resolution—a four-fold increase—one would need roughly 16 times more data to maintain the same statistical power per bin. This non-linear scaling means that the desired biological resolution must be decided upon before the experiment is conducted to ensure adequate sequencing depth is budgeted and planned for.14 An experiment designed to study large-scale compartments at 1 Mb resolution will be vastly underpowered for identifying specific 10 kb chromatin loops.
Conclusion: The Future is Four-Dimensional
Recap: A New Dimension of Biology
The family of Chromosome Conformation Capture technologies has fundamentally reshaped our understanding of the genome. Over the past two decades, these methods have propelled the field from a one-dimensional view focused on the linear sequence of DNA to a dynamic, three-dimensional perspective where the physical architecture of chromatin is recognized as a central player in gene regulation.1 By providing the tools to map the intricate folds, loops, and domains of the genome, the C-series technologies have uncovered fundamental principles of nuclear organization and provided profound new insights into the mechanisms of health and disease.
Emerging Frontiers: Pushing the Boundaries of 3D Genomics
The field of 3D genomics continues to evolve at a rapid pace, with new innovations constantly pushing the boundaries of resolution and information content. The next generation of methods is focused on overcoming the limitations of existing techniques and adding new layers of data to create an even more complete picture of genome function.
- Single-Cell Resolution: A major limitation of bulk C-methods is that they provide a population-averaged snapshot of chromatin architecture, obscuring the inherent cell-to-cell variability that exists within any tissue or cell culture. The development of single-cell Hi-C (scHi-C) and related techniques represents a major breakthrough, allowing researchers to map the 3D genome of individual cells.11 This is revealing the dynamic and often stochastic nature of chromatin folding and is particularly powerful for dissecting the heterogeneity of complex tissues like the brain or tumors, where different cell types or clonal populations may exhibit distinct genome architectures. Methods using microfluidics and cellular barcoding are further increasing the throughput of single-cell analysis, making large-scale studies of cellular heterogeneity feasible.
- Multi-omic Integration: The ultimate goal is to directly link chromatin structure to its functional consequences. To this end, powerful new methods are being developed that can simultaneously profile multiple "omic" layers within the same cell or nucleus. Techniques that combine Hi-C with transcriptomics (e.g., Paired-HiC) or with epigenomic marks like DNA methylation are beginning to provide an unprecedented, multi-modal view of the genome. This integration allows for the direct correlation of changes in 3D structure with changes in gene expression or epigenetic state, forging a causal link between genome architecture and function.
- The Fourth Dimension: Time: The final frontier for the field is to understand not just how the genome is organized in space, but how that organization changes over time. Large-scale research initiatives like the 4D Nucleome Consortium are dedicated to this goal, aiming to map the temporal dynamics of chromatin architecture during critical biological processes such as the cell cycle, cellular differentiation, and in response to external stimuli.4 This moves the field from a static 3D picture to a dynamic 4D movie of the living genome.
Summary
The study of the 3D genome is no longer a specialized subfield of genomics; it has become a central and indispensable component of modern biology and medicine. Understanding the principles of chromatin architecture is now fundamental to research in areas ranging from developmental biology and immunology to neurobiology and cancer research. As these technologies continue to improve in resolution, throughput, and informational content, they will undoubtedly continue to provide profound insights into the regulation of the genome and open up new avenues for therapeutic intervention, including the identification of novel drug targets for diseases driven by architectural defects in the genome.6 The journey into the architecture of the nucleus has just begun, and it promises to yield discoveries that will continue to redefine our understanding of life itself.
Frequently Asked Questions (FAQ)
Q1: What is the main difference between 3C and Hi-C?
A1: The main difference is scope and methodology. 3C is a "one-vs-one" method used to validate a suspected interaction between two specific genomic regions. Hi-C is an "all-vs-all" method that maps every possible interaction across the entire genome in an unbiased way.
Q2: Which 3C method is best for discovering new enhancers for a gene?
A2: 4C-seq is the ideal choice for this purpose. As a "one-vs-all" technique, it takes a single viewpoint, such as a gene's promoter, and identifies all of its interacting partners throughout the genome, making it perfect for discovering unknown regulatory elements like enhancers.
Q3: What are TADs and A/B compartments?
A3: They are key features of 3D genome architecture discovered by Hi-C. A/B compartments are large-scale divisions of the genome into active (A, gene-rich) and inactive (B, gene-poor) regions. Topologically Associating Domains (TADs) are smaller, self-interacting regions that act as insulated regulatory neighborhoods, constraining enhancer-promoter interactions.
Q4: How does sequencing depth affect Hi-C resolution?
A4: Sequencing depth is critical for Hi-C resolution. Higher resolution (seeing finer details with smaller genomic bins) requires exponentially more sequencing data. For example, moving from 40 kb to 10 kb resolution can require about 16 times more reads, significantly increasing the cost and complexity of the experiment.
References
- Understanding 3D Genome Organization and Its Effect on Transcriptional Gene Regulation Under Environmental Stress in Plant: A Chromatin Perspective - Frontiers, accessed October 28, 2025, https://www.frontiersin.org/journals/cell-and-developmental-biology/articles/10.3389/fcell.2021.774719/full
- (PDF) Chromosome conformation capture technologies and their ..., accessed October 28, 2025, https://www.researchgate.net/publication/301734126_Chromosome_conformation_capture_technologies_and_their_impact_in_understanding_genome_function
- Comparison of Capture Hi-C Analytical Pipelines - Frontiers, accessed October 28, 2025, https://www.frontiersin.org/journals/genetics/articles/10.3389/fgene.2022.786501/full
- Gene regulation in the 3D genome | Human Molecular Genetics - Oxford Academic, accessed October 28, 2025, https://academic.oup.com/hmg/article/27/R2/R228/4996214
- Principles of Chromosome Architecture Revealed by Hi-C - PMC - NIH, accessed October 28, 2025, https://pmc.ncbi.nlm.nih.gov/articles/PMC6028237/
- Discovery of therapeutic targets in cardiovascular diseases using high-throughput chromosome conformation capture (Hi-C) - Frontiers, accessed October 28, 2025, https://www.frontiersin.org/journals/genetics/articles/10.3389/fgene.2025.1515010/full
- 3C-based methods to detect long-range chromatin interactions - PMC - NIH, accessed October 28, 2025, https://pmc.ncbi.nlm.nih.gov/articles/PMC11469636/
- Hi-C, a chromatin 3D structure technique advancing the functional genomics of immune cells - Frontiers, accessed October 28, 2025, https://www.frontiersin.org/journals/genetics/articles/10.3389/fgene.2024.1377238/full
- The second decade of 3C technologies: detailed insights into nuclear organization - PMC, accessed October 28, 2025, https://pmc.ncbi.nlm.nih.gov/articles/PMC4926860/
- Hi-C: A comprehensive technique to capture the conformation of genomes - PMC - NIH, accessed October 28, 2025, https://pmc.ncbi.nlm.nih.gov/articles/PMC3874846/
- Chromosome conformation capture - Wikipedia, accessed October 28, 2025, https://en.wikipedia.org/wiki/Chromosome_conformation_capture
- a Key steps distinguishing 3C, 4C, and 5C assays. b Key steps of the... - ResearchGate, accessed October 28, 2025, https://www.researchgate.net/figure/a-Key-steps-distinguishing-3C-4C-and-5C-assays-b-Key-steps-of-the-Hi-C-approach-which_fig3_301734126
- 4C-Seq validation of MYC super-enhancer interaction in primary T-ALL a)... - ResearchGate, accessed October 28, 2025, https://www.researchgate.net/figure/4C-Seq-validation-of-MYC-super-enhancer-interaction-in-primary-T-ALL-a-4C-seq-analysis_fig7_340107080
- The Hitchhiker's Guide to Hi-C Analysis: Practical guidelines - PMC - PubMed Central, accessed October 28, 2025, https://pmc.ncbi.nlm.nih.gov/articles/PMC4347522/
- Chromosome Conformation Capture Analysis (3C) Techniques - EpiGenie, accessed October 28, 2025, https://epigenie.com/epigenetics-research-methods-and-technology/chromatin-analysis/chromatin-conformation-analysis-3c-techniques/
- A decade of 3C technologies: insights into nuclear organization - PMC, accessed October 28, 2025, https://pmc.ncbi.nlm.nih.gov/articles/PMC3258961/
- 3C and 3C-based techniques: the powerful tools for spatial genome organization deciphering - PMC - NIH, accessed October 28, 2025, https://pmc.ncbi.nlm.nih.gov/articles/PMC5845197/
- Introduction of the Hi-C technology: Principles,Analysis, Advantages and Implications, accessed October 28, 2025, /epigenetics/resource-introduction-of-the-hi-c-technology.html
- Hi-C Sequencing: Principle, Steps, Process, Uses - Microbe Notes, accessed October 28, 2025, https://microbenotes.com/hi-c-sequencing/
- Mapping chromatin interactions with 5C technology: 5C; a quantitative approach to capturing chromatin conformation over large genomic distances - PMC, accessed October 28, 2025, https://pmc.ncbi.nlm.nih.gov/articles/PMC3874844/
- Investigation of the Basic Steps in the Chromosome Conformation Capture Procedure - Frontiers, accessed October 28, 2025, https://www.frontiersin.org/journals/genetics/articles/10.3389/fgene.2021.733937/full
- Comparison of different 3C-based methodologies. 3C libraries share... - ResearchGate, accessed October 28, 2025, https://www.researchgate.net/figure/Comparison-of-different-3C-based-methodologies-3C-libraries-share-the-indicated-steps_fig2_313230173
- Strategy overview of 3C-based methods | Download Scientific Diagram - ResearchGate, accessed October 28, 2025, https://www.researchgate.net/figure/Strategy-overview-of-3C-based-methods_fig1_323674862
- Can someone explain the differences between the different 'chromosomal confirmation capture' technologies (3C vs 4C vs Hi-C)? | ResearchGate, accessed October 28, 2025, https://www.researchgate.net/post/Can-someone-explain-the-differences-between-the-different-chromosomal-confirmation-capture-technologies-3C-vs-4C-vs-Hi-C
- Long-range interaction and chromatin loops: from 3C to Hi-C | CMB-UNITO, accessed October 28, 2025, https://cmb.i-learn.unito.it/mod/wiki/prettyview.php?pageid=141
- Hi-C (genomic analysis technique) - Wikipedia, accessed October 28, 2025, https://en.wikipedia.org/wiki/Hi-C_(genomic_analysis_technique)
- 4C-seq from beginning to end: A detailed protocol for sample preparation and data analysis | Hubrecht Institute, accessed October 28, 2025, https://www.hubrecht.eu/app/uploads/2017/11/4C-seq-from-beginning-to-end_-A-detailed-protocol-for-sample-preparation-and-data-analysis.pdf
- FourCSeq: analysis of 4C sequencing data | Bioinformatics - Oxford Academic, accessed October 28, 2025, https://academic.oup.com/bioinformatics/article/31/19/3085/211447
- 4-C/4C-Seq - Illumina, accessed October 28, 2025, https://www.illumina.com/science/sequencing-method-explorer/kits-and-arrays/4-c-4c-seq.html
- 4C-ker: A Method to Reproducibly Identify Genome-Wide Interactions Captured by 4C-Seq Experiments | PLOS Computational Biology - Research journals, accessed October 28, 2025, https://journals.plos.org/ploscompbiol/article?id=10.1371/journal.pcbi.1004780
- 4C-seq revealed long-range interactions of a functional enhancer at the 8q24 prostate cancer risk locus - PMC, accessed October 28, 2025, https://pmc.ncbi.nlm.nih.gov/articles/PMC4776156/
- Chromosome Conformation Capture Carbon Copy (5C): A massively parallel solution for mapping interactions between genomic elements - PMC - NIH, accessed October 28, 2025, https://pmc.ncbi.nlm.nih.gov/articles/PMC1581439/
- Chromosome Conformation Capture Carbon Copy (5C): a massively parallel solution for mapping interactions between genomic elements. - ENCODE, accessed October 28, 2025, https://www.encodeproject.org/publications/a24ed819-d9e3-4d95-8ae6-8f89c5d5a325/
- Comparison of Hi-C results using in-solution versus in-nucleus ligation - ResearchGate, accessed October 28, 2025, https://www.researchgate.net/publication/281303306_Comparison_of_Hi-C_results_using_in-solution_versus_in-nucleus_ligation
- (PDF) Hi‐C 3.0: Improved Protocol for Genome‐Wide Chromosome ..., accessed October 28, 2025, https://www.researchgate.net/publication/353363274_Hi-C_30_Improved_Protocol_for_Genome-Wide_Chromosome_Conformation_Capture
- 3C methods in cancer research: recent advances and future prospects - PMC, accessed October 28, 2025, https://pmc.ncbi.nlm.nih.gov/articles/PMC11059347/
- Which method is now the best to identify chromosomal interactions? - ResearchGate, accessed October 28, 2025, https://www.researchgate.net/post/Which_method_is_now_the_best_to_identify_chromosomal_interactions
- 4Cin: A computational pipeline for 3D genome modeling and virtual Hi-C analyses from 4C data - Research journals - PLOS, accessed October 28, 2025, https://journals.plos.org/ploscompbiol/article?id=10.1371/journal.pcbi.1006030
- (PDF) Software tools for visualizing Hi-C data - ResearchGate, accessed October 28, 2025, https://www.researchgate.net/publication/313332867_Software_tools_for_visualizing_Hi-C_data
- Full article: Comparison of Normalization Methods for Hi-C Data - Taylor & Francis Online, accessed October 28, 2025, https://www.tandfonline.com/doi/full/10.2144/btn-2019-0105
- 3D structure of individual mammalian genomes studied by single ..., accessed October 28, 2025, https://www.researchgate.net/publication/316071667_3D_structure_of_individual_mammalian_genomes_studied_by_single_cell_Hi-C
- Sci-Hi-C: a single-cell Hi-C method for mapping 3D genome organization in large number of single cells | bioRxiv, accessed October 28, 2025, https://www.biorxiv.org/content/10.1101/579573v1
- Unveiling Chromatin Architecture with Droplet Hi-C: A Breakthrough in Single-Cell Analysis, accessed October 28, 2025, https://cmm.ucsd.edu/research/epigenomics/media-and-events/news-unveiling-chromatin-architecture.html
- A generalizable Hi-C foundation model for chromatin architecture, single-cell and multi-omics analysis across species | bioRxiv, accessed October 28, 2025, https://www.biorxiv.org/content/10.1101/2024.12.16.628821v1.full-text
- A generalizable Hi-C foundation model for chromatin architecture, single-cell and multi-omics analysis across species - PMC - NIH, accessed October 28, 2025, https://pmc.ncbi.nlm.nih.gov/articles/PMC11702576/
For research purposes only, not intended for personal diagnosis, clinical testing, or health assessment