
 Sample Submission Guidelines
CD Genomics proprietary GenSeqTM Technology provides comprehensive Single-Cell Sequencing services. These global gene expression patterns in single cells already have dramatically advanced cell biology.
What is Single-Cell Sequencing
Single-cell sequencing represents a significant advancement in our comprehension of cellular heterogeneity and biological processes. This sophisticated technology facilitates the examination of genomes, transcriptomes, epigenomes, and proteomes at the single-cell resolution, thereby delivering unparalleled insights into cellular functions and interactions. In contrast to conventional bulk sequencing, which yields averaged data from a mixture of cells, single-cell sequencing discloses the distinct molecular signatures of individual cells, thereby unveiling the intricate complexity and diversity present within tissues and organisms.
Why Conduct Single-Cell Sequencing
Taking the transcriptome as an example, traditional bulk RNA sequencing (Bulk RNA-seq) involves extracting and sequencing the mixed RNA from tissues, organs, or clusters of cells, yielding average transcriptomic data for those cell populations. For instance, using Bulk RNA-seq, one can identify differential gene expression between tumor and adjacent non-tumor tissues, noting variations in oncogenes and tumor suppressor genes. However, within a tumor, there exist genetic and transcriptomic variations among cells located at the tumor core, periphery, lymphatic metastases, and distant metastases. These differences may play critical roles in cancer cell invasion, metastasis, and the evolution of drug resistance, subsequently influencing the efficacy of therapeutic interventions.
Conversely, single-cell RNA sequencing (scRNA-seq) allows for the examination of tumor heterogeneity at the individual cell level. This technique facilitates the study of clonal evolution and development of cancer cells, early-stage cancer invasion, mutation rates and types in cancer cells, tracking of metastasis and dissemination, characterization of the tumor microenvironment, and understanding the evolution of drug resistance during cancer treatment.
Methodologies for Single-Cell Sequencing
Early approaches to single-cell sequencing involved isolating individual cells followed by low-input library preparation and sequencing. Methods for isolating single cells encompassed techniques such as limiting dilution, flow cytometry, laser capture microdissection, and micromanipulation. While these methods are capable of isolating single cells, they are often complex, time-consuming, costly, and low in throughput, which hinders their widespread application on a large scale.
How to Achieve High-Throughput Single-Cell Capture
Contemporary strategies primarily employ DNA barcoding to facilitate the identification of individual cells. Each cell is tagged with a unique barcode sequence, permitting the pooled library construction and subsequent differentiation of nucleic acids originating from distinct cells based on their barcode. This approach allows for the simultaneous analysis of hundreds to thousands of single cells using a single library preparation and sequencing run.
Here, we discuss two prominent techniques utilizing this principle for single-cell sequencing:
1. Microplate-Based Single-Cell Sequencing:
The underlying method involves controlling the concentration of the cell suspension to allocate dissociated cells into individual wells of a microplate. Once the cells settle at the bottom, magnetic beads are added to each well. These beads are pre-loaded with Read1 sequences, barcodes, molecular barcodes and capture sequences. In each well, single cells undergo lysis, releasing their nucleic acids, which are then captured by the magnetic beads. The beads are subsequently pooled for library construction and sequencing. Notable methods employing this technique include BD Rhapsody and Singleron.
2. Microdroplet-Based Single-Cell Sequencing:
This technique starts with the dissociation of tissue to generate a single-cell suspension. Utilizing microfluidic chips, cells and capture beads are encapsulated into droplets by leveraging the immiscibility of oil and water phases. The capture beads within these droplets are equipped with Read1 sequences, barcodes, molecular barcodes, and capture sequences. Within each droplet, individual cells are lysed, their nucleic acids released and captured by the beads. These beads are then pooled for library preparation and subsequent sequencing. Current methods using this strategy include Drop-seq, inDrop, and 10× Genomics.
3. 10× Genomics Single-Cell Solutions:
10× Genomics dominates the single-cell market, offering a variety of products that facilitate single-cell transcriptomics (scRNA-seq), single-cell immune profiling (siRNA-seq), single-cell chromatin accessibility (snATAC-seq), multi-omics (snRNA+ATAC), and surface protein profiling (scCITE-seq) at single-cell resolution.
Our Single-Cell Sequencing Services
We utilize advanced single-cell sequencing technologies, such as 10x Genomics Chromium, to provide comprehensive solutions for profiling individual cells, analyzing tumor heterogeneity, and studying developmental processes. Our expert team ensures precise and reliable results through meticulous quality control.
Single-Cell RNA Sequencing
-
scRNA Sequencing captures gene expression at the level of individual cells, offering a clear picture of how each cell contributes to the function of a tissue. It's especially valuable for identifying rare cell types and understanding the nuances of cellular behavior within complex biological systems.
-
Single-Cell DNA Sequencing
-
This method delves into the genetic makeup of single cells, uncovering specific variations and mutations with high precision. It provides crucial insights into the genetic diversity of tumors and helps in pinpointing genetic abnormalities associated with various diseases.
-
Single-Cell DNA Methylation Sequencing
-
By analyzing DNA methylation patterns at the single-cell level, this approach reveals how epigenetic modifications influence gene expression and maintain cellular identity. It's essential for studying the role of epigenetics in development and disease.
-
10x Genomics Single-Cell Sequencing
-
Utilizing cutting-edge microfluidic technology and barcoding, 10x Genomics delivers comprehensive single-cell data. This platform excels in providing detailed insights into transcriptomic, genomic, and epigenomic landscapes, enhancing our understanding of cellular diversity and complex biological interactions.
-
Advantages of Single-Cell Sequencing
- Comprehensive Workflow: A complete, end-to-end process designed for the whole transcriptome analysis of individual cells.
- Maximal Throughput: Facilitates the parallel processing of up to 96 single cells per run, an unprecedented scale.
- User-Friendly: Requires less than three hours of hands-on time. Direct processing from single cells is enabled, with no need for RNA fragmentation and purification steps.
- Cost-Effective: Offers a significant cost reduction, being one-eighth the price of other library preparation systems currently available on the market.
- Cutting-Edge Technology: We employ the latest single-cell sequencing platforms, including 10x Genomics et, ensuring precise and reliable results.
- Expert Bioinformatics Support: Our bioinformatics team provides robust data analysis, offering insights into cellular heterogeneity, lineage tracing, and gene expression dynamics.
- Customizable Solutions: We offer tailored solutions to meet the specific requirements of your research, from experimental design to data interpretation.
Applications of Single-Cell Sequencing
- Profiling scarce clinical samples
- Measuring intra-tumor heterogeneity and guiding chemotherapy
- Cancer cells evolution analysis during tumor progression
- Pre-implantation genetic diagnosis (PGD)
- Investigating Immune Cell Diversity
- Unraveling Developmental Biology
- Studying Neurological Disorders
- Exploring Microbial Ecosystems
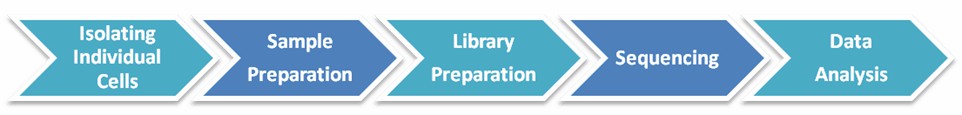
Single-Cell Sequencing Workflow
The advent of flow cytometry and laser capture microdissection has made it possible to capture single cells, and the DNA or RNA of single cells was amplified for single-cell sequencing. The general workflow for single-cell sequencing is outlined below.
Sample Requirements
Below are the sample requirements for some of our single-cell sequencing services. For more detailed information, please refer to the specific service pages or Sample Submission Guidelines. Additionally, if you are interested in our services, please contact us to confirm the sequencing sample requirements.
| Service | Sample Type | Recommended Quantity | Minimum Quantity |
|---|---|---|---|
| ScRNA-seq | Single cell suspension, Fresh tissue | 2×10⁶ cells | 1×10⁶ cells |
| 10X Visium Spatial Transcriptome | OCT embedded tissue, FFPE | 6.5mm×6.5mm | |
| Single Cell Genome Sequencing | Cells DNA |
1-103, Single cells are stored in 1xPBS buffer (without Ca2+, Mg2+), the volume is within 2 μL ≥ 0.5pg |
|
| ScWGBS | Cell lines, primary cells, fresh tissue, frozen cells |
Use 200µl PCR tubes to store cells (single or multiple cells), 5µl of lysate per tube, and no more than 1µl of buffer when collecting cells. ≥3 biological replicates | |
| ScRRBS | Cell lines, primary cells, fresh tissue, frozen cells |
Use 200µl PCR tubes to store cells (single or multiple cells), 5µl of lysate per tube, and no more than 1µl of buffer when collecting cells. ≥3 biological replicates |
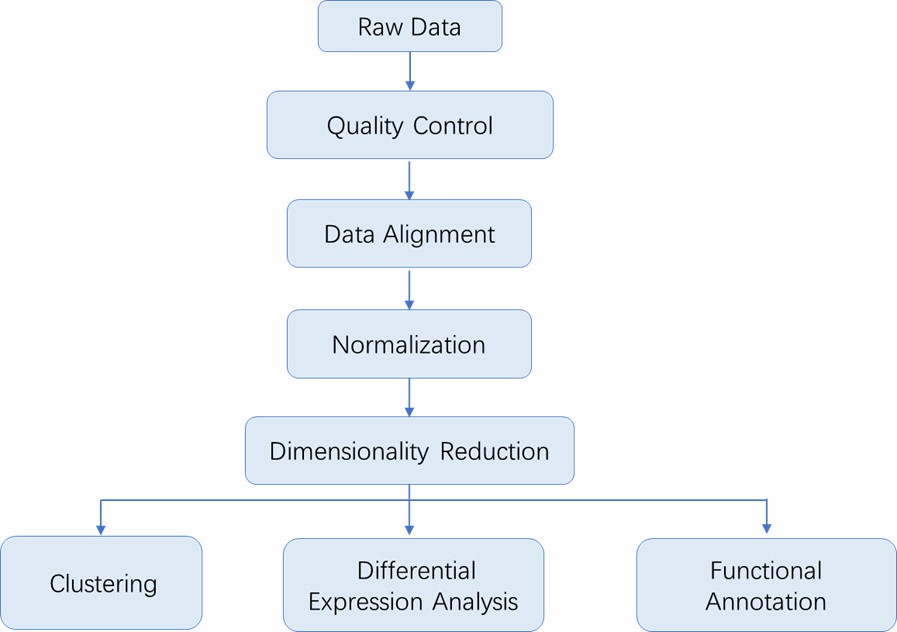
Analysis Pipeline
Deliverables
- The original sequencing data
- Experimental results
- Data analysis report
- Details in Single-Cell Sequencing for your writing (customization)
CD Genomics's Single-Cell Sequencing conference explores the connections between cellular diversity within tissues and the functionality of organs, shedding light on the underlying causes of various diseases. For any additional requests or inquiries, please do not hesitate to reach out to us.
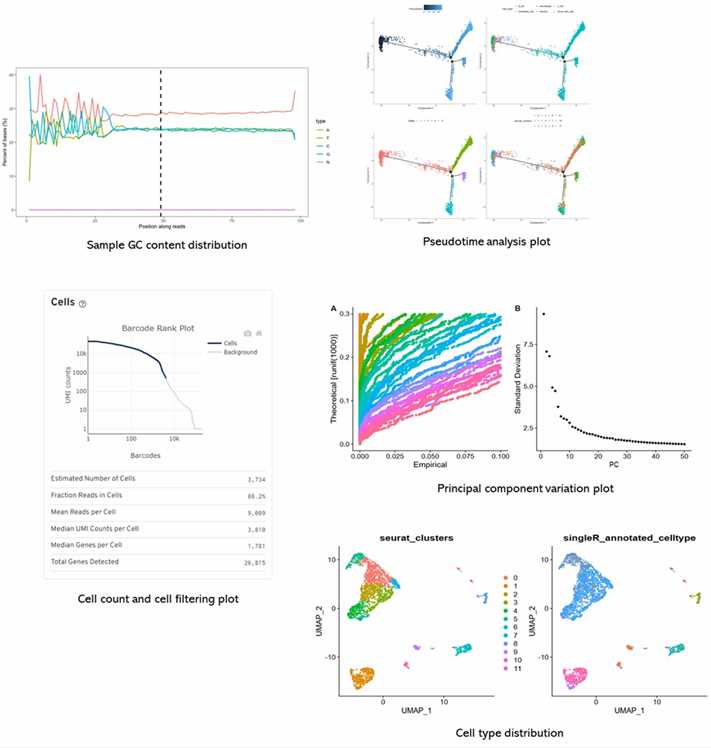
Partial results are shown below:
1. The principle, advantages and disadvantages of single-cell genome amplification.
i. MDA (Multiple Displacement Amplification)
Invented by the Laskin et al. in 2001. Reacted using random six polymer primers and φ29 DNA polymerase, which had strong chain replacement properties and could amplify the DNA fragment of 50~100kb under isothermal conditions. At the same time, because of its 3 '-5' exonuclease activity and proofreading activity, the φ29 DNA polymerase has high fidelity. The MDA method has a higher genome coverage.
ii. MALBAC(Multiple Annealing and Looping–Based Amplification Cycles)
The Quasilinear amplification process reduces the sequence preference of exponential amplification. The 5 'of amplified primers containing the common sequence of 27bp and 3' is a random sequence of 8bp, which can be combined with the template at low temperature at 15~20 C, and then amplify these ring-shaped amplicons after the quasilinear amplification of 8~12 cycles.
The advantage of MALBAC method is that sequence preference is repeatable between different cells. Because of its better homogeneity of amplification, its data is more suitable for CNV analysis. The weakness of MALBAC is that the fidelity of polymerase it used is not as good as φ29 DNA polymerase, so MALBAC will have more false positives when detecting SNV; in addition, because of its repeatability sequence preference, the region of low amplification in the genome is sometimes lost in the process of amplification.
2. Sampling requirements for single-cell sequencing.
MDA amplification: the sample volume can not exceed 2 μL. The PCR tube that company supply contains 2 μL PBS. MALBAC amplification: the sample volume can not exceed 1 μL. Ensure that samples are free of Ca2+, Mg2+, the company provides a tube containing 4 μL lysate. Samples should be separated independently as far as possible, avoiding cell adhesion and cell fragments, affecting the quality of amplification.
Single-cell analysis of the cellular heterogeneity and interactions in the injured mouse spinal cord
Journal: Journal of Experimental Medicine
Impact factor: 12.6
Published: June 16 2021
Background
In spinal cord injury (SCI), diverse glial and vascular cells, along with infiltrating leukocytes, drive the complex wound healing process. Key stages include an early immune response, peak glial proliferation, and subsequent fibrosis and gliosis. Single-cell RNA sequencing (scRNA-seq) offers detailed insights into cell types and their interactions, enhancing our understanding of SCI and other CNS injuries.
Materials & Methods
Sample Preparation
- Mice and SCIs
- Tissue dissociation
- Spinal cord samples
Sequencing
- Flow cytometry
- scRNA-seq
- 10X Genomics platform
- Preprocessing and quality control
- Analysis of all SCI cells
- Differential expression testing
- GO analysis
Results
The authors performed single-cell RNA sequencing on spinal cord injury (SCI) samples to analyze cellular diversity. This identified 66,178 cells and 15 distinct types, including immune, vascular, and glial cells. Unique molecular signatures and injury-dependent gene changes were observed, offering insights into specific cell responses and potential biomarkers.
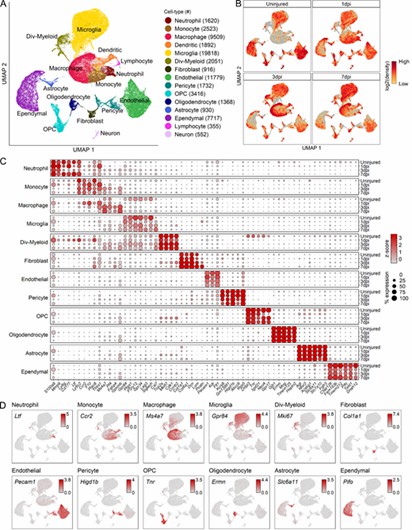 Fig 1. Transcriptomic identification of major cell types that comprise the mouse mid-thoracic spinal cord contusion site at acute time points.
The analysis revealed 12 myeloid cell subtypes, including four microglial and two macrophage types, with significant temporal changes after spinal cord injury (SCI). Microglia shifted from homeostatic to inflammatory states, while macrophages evolved from chemotaxis-inducing to inflammatory subtypes. These findings were confirmed by both immunohistochemistry and flow cytometry.
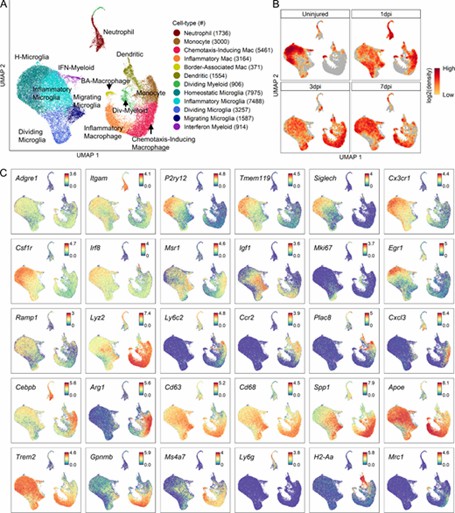 Fig 2. Transcriptomic identification of major myeloid subtypes acutely after SCI.
The analysis revealed nine macroglial clusters with distinct changes post-injury. Astroependymal cells peaked at 1 dpi and then declined, while oligodendrocyte lineage cells progressed from OPCs to mature forms. OPCs and astrocytes initially respond similarly but develop unique functions by 7 dpi, with OPCs also playing a role in the glial scar.
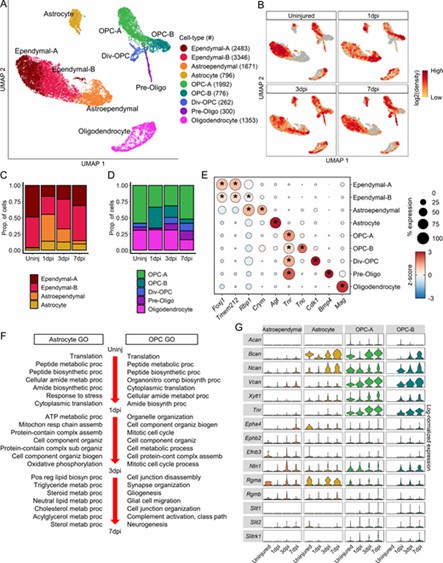 Fig 3. Molecular and temporal profile of macroglial heterogeneity acutely after SCI.
Conclusion
This study uses single-cell transcriptomics to map cell types and their roles at the SCI injury site. It reveals distinct phases of myeloid cell behavior, including inflammation and migration, and identifies key roles of astrocytes and tip cells in vascular remodeling. Despite some limitations in cell recovery accuracy, the data provides new insights into cellular interactions and processes in SCI.
Reference
- Milich LM, Choi JS, Ryan C, et al. Single-cell analysis of the cellular heterogeneity and interactions in the injured mouse spinal cord. Journal of Experimental Medicine. 2021, 218(8):e20210040.


