
 Sample Submission Guidelines
CD Genomics has been providing the accurate and affordable RNA-Seq (RNA sequencing) service for decades. We combine both Illumina (short reads) and PacBio (long reads) platforms to obtain the transcriptome that allows de novo assembly or re-sequencing for bacteria, plants, animals and humans.
What Is RNA Seq?
RNA-Seq, a pivotal tool employing Next-Generation Sequencing (NGS) technologies, is designed to create detailed maps and quantifications of the transcriptome, thereby unmasking information such as gene transcription levels, the structure and expression of transcripts, RNA modification, and non-coding RNA, among other facets. The transcriptome, a comprehensive collection of all transcripts in a cell, offers vital information regarding transcript levels at specific developmental stages or physiological states. Comprehending the transcriptome is essential to interpret the functional elements of the genome, as well as to understand biological development and diseases. Key objectives of transcriptomics encompass cataloging all species of transcripts; pinpointing the transcriptional structure of genes; and quantifying the expression levels of each transcript under varying conditions.
In offering an unbiased high-resolution view of global transcription patterns, RNA-Seq introduces an economical and accurate method for gene expression quantification and differential gene expression analysis across multiple sample groups. It enables the identification of novel and previously unpredicted transcripts, independent of a reference genome, hence facilitating de novo assembly of unstudied transcriptomes. Further, it allows for the discovery of new gene architectures, alternatively spliced isoforms, gene fusions, SNP/InDel, and allele-specific expressions (ASE).
Advantages of RNA-Seq
- Quantitative and precise measurements of RNA molecules at a single base-pair resolution
- Discovery of novel transcripts, splice variants, and gene fusions
- Remarkably, this strategy is applicable to any species, regardless of the availability of the reference genome
- A practice affording comparable or even lower costs relative to many other methodologies.
- The approach adeptly detects various RNA types, spanning mRNA, miRNA, lncRNA, amongst others, proffering a comprehensive viewpoint on the RNA present in cells or tissues.
- Noteworthy is the capacity to simultaneously analyze multiple samples, efficiently accruing abundant data—an attribute underscoring its profound utility in high-throughput RNA analytics.
RNA-Seq Development
Sequencing technology has undergone significant transformations and advancements over time, particularly over the past two to three decades. Initially, Sanger sequencing was instituted as the first-generation sequencing method. By leveraging reversible termination synthesis reactions in binary chemistry, Sanger sequencing enabled the determination of base sequences at the DNA termini in accordance with the RNA sequence. The 1990s marked noteworthy strides in sequencing technology coinciding with the commencement of the whole-genome sequencing projects. Introduction of high-throughput sequencing platforms, such as 454 sequencing, Illumina sequencing, and Ion Torrent sequencing, facilitated the feasibility of RNA sequencing. Traditional RNA sequencing technologies often required a substantial volume of cells to obtain a satisfactory quantity of RNA for sequencing, which overshadowed the heterogeneity amongst different cells. In essence, these techniques uncover the gene expression characteristics of distinct cellular types and states.
The Applications of RNA-Seq
RNA sequencing (RNA-seq) stands as a widely employed technique, applicable across various domains within biological and medical research. Below delineates several common applications of RNA-seq:
- Gene expression analysis
- Differential gene expression analysis
- Discovery of novel genes
- Alternative splicing analysis
- Biomarker discovery
- Non-coding RNA research
- Gene function elucidation
- Population genetics and evolutionary biology
Indeed, with technological advancements, the scope of RNA-seq applications continues to expand incessantly.
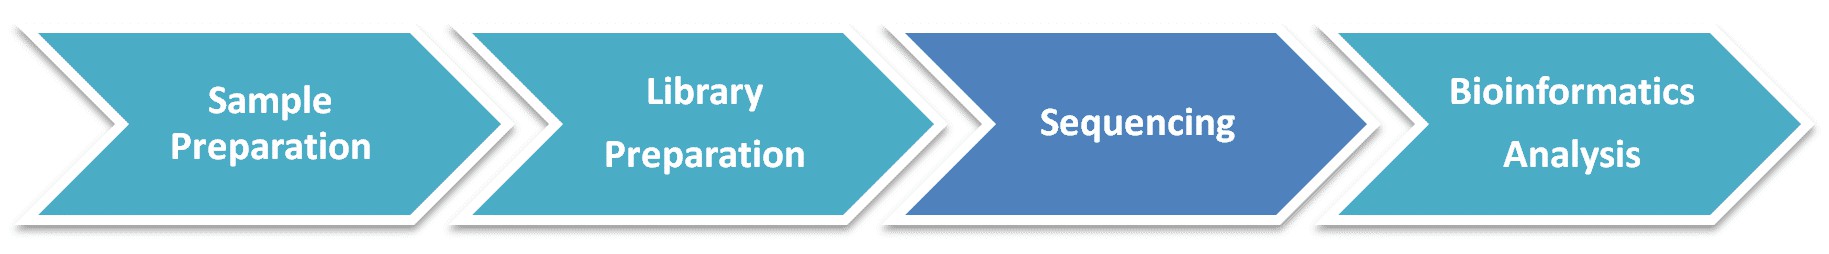
RNA-Seq Workflow
CD Genomics combines both Illumina HiSeq and PacBio systems to provide a fast and accurate RNA-Seq and bioinformatics analysis for any species. Our highly experienced expert team executes quality management, following every procedure to ensure confident and unbiased results. The general workflow for RNA-Seq is outlined below.
Service Specification
Sample requirements and preparation
|
|
 Click |
Sequencing
|
 |
Bioinformatics Analysis We provide customized bioinformatics analysis including:
|
Analysis pipeline
Deliverables
- The original sequencing data
- Experimental results
- Data analysis report
- Details in RNA-Seq for your writing (customization)
CD Genomics provides full RNA sequencing service package including sample standardization, library construction, deep sequencing, raw data quality control, genome assembly, and customized bioinformatics analysis. We can tailor this pipeline to your research interest. If you have additional requirements or questions, please feel free to contact us.
References:
- Marguerat S, Bähler J. RNA-seq: from technology to biology. Cellular and molecular life sciences, 2010, 67: 569-579.
- Hrdlickova R, Toloue M, Tian B. RNA‐Seq methods for transcriptome analysis. Wiley Interdisciplinary Reviews: RNA, 2017, 8(1): e1364.
- Saliba A E, Westermann A J, Gorski S A, et al. Single-cell RNA-seq: advances and future challenges. Nucleic acids research, 2014, 42(14): 8845-8860.
Partial results are shown below:

Sequencing quality distribution

A/T/G/C Distribution

IGV Browser Interface

Correlation Analysis Between Samples

PCA Score Plot

Venn Diagram

Volcano Plot

Statistics Results of GO Annotation

KEGG Classification
1. How many biological replicates do I need for each condition?
We suggest you to submit at least 3 replicates per sample to increase confidence and reduce experimental error. Note that this only serves as a guideline, and the final number of replicates will be determined by you based on your final experimental conditions.
2. What advantages does NGS have over Microarray?
Various technologies have been developed for transcriptome analysis, such as microarray and NGS. Compared to microarray, NGS has several advantages, including:
i. RNA-Seq is a sensitive tool for gene expression profiling. Compared to microarray, RNA-Seq offers a digital read that is more accurate for all gene expression.
ii. Microarray can only offer limited gene expression information (i.e., the genes incorporated into the chip), whereas NGS is a more comprehensive approach that yields additional information for novel gene variants and low-abundance transcripts.
iii. NGS produces far more reproducible and reliable results than microarray. It is not necessary to conduct qPCR after RNA-Seq, whereas it is a standard procedure for microarray to verify results.
3. When is it necessary to eliminate rRNA before sequencing?
Ribosomal RNA (rRNA) constitutes over 90% of total RNA. Performing RNA-Seq without enriching for poly-A or depleting rRNA will yield reads predominantly originating from rRNA. For instance, less than one-tenth of the reads would carry useful information. Transcripts from rRNA-depleted transcriptomes are conventionally regarded as total RNA, encompassing mRNA and non-coding RNA. Consequently, poly-A enrichment or rRNA depletion is essential for any sequencing platform.
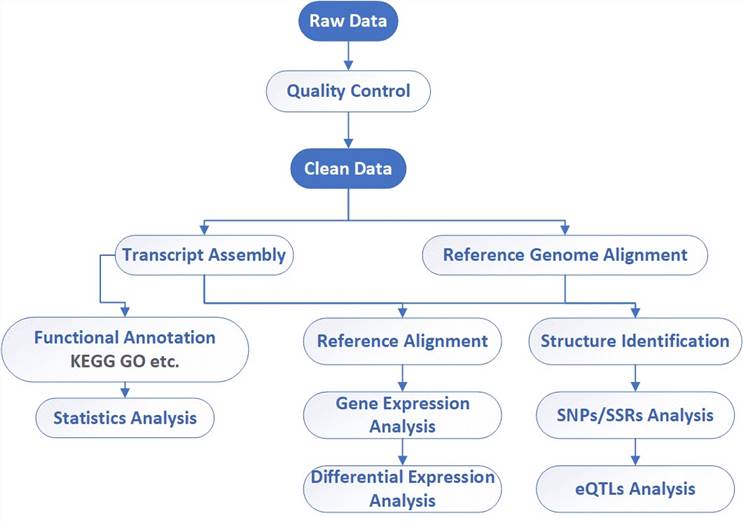
4. What is the conventional pipeline for RNA-Seq data analysis?
The conventional pipeline for RNA-Seq data includes raw data quality control, alignment, assembly, gene expression profiling, and other analyses.
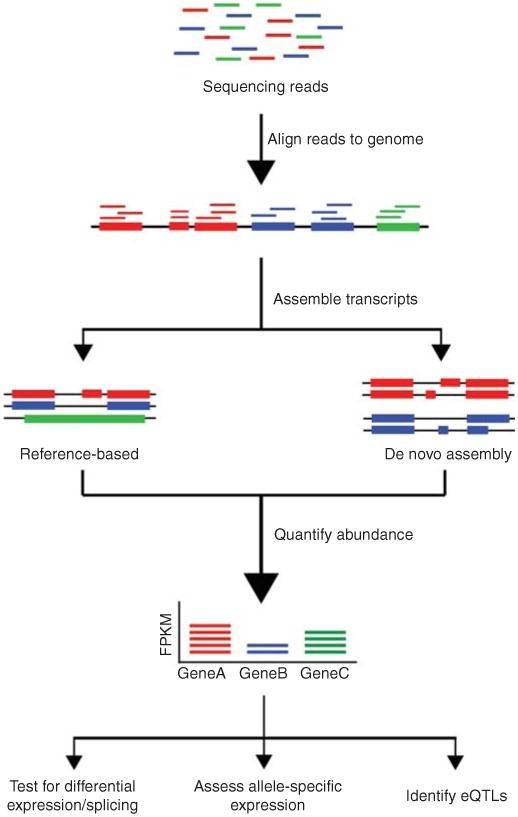 Figure 1. Overview of RNA-Seq data analysis (Kukurba and Montgomery 2015).
The distinction between DNA sequencing and RNA sequencing stems from their different analytical capabilities. DNA sequencing enables us to understand the composition of genes within an organism's genome, discern their functions, and gain a comprehensive knowledge of intergenic relationships. On the other hand, RNA sequencing refines our comprehension of biological mechanisms and changes occurring in life processes. This is achieved by studying expression levels, diversity, and regulatory mechanisms.
RNA sequencing specifically targets RNA molecules, unveiling the structure and function of the transcriptome and identifying variations in gene expression. In the process, RNA molecules are transcribed into their complementary DNA counterparts (known as cDNA) which are then sequenced. Common components of RNA sequencing generally include full transcriptome sequencing, differential expression analysis, among others.
Reference:
- Kukurba K R, Montgomery S B. RNA sequencing and analysis. Cold Spring Harbor protocols, 2015(11): pdb. top084970.
Transcriptome characterization by RNA sequencing identifies a major molecular and clinical subdivision in chronic lymphocytic leukemia
Journal: Genome Research
Impact factor: 11.92
Published: online November 21, 2013
Abstract
The authors performed deep RNA sequencing in different subpopulations of normal B-lymphocytes and chronic lymphocytic leukemia (CLL) cells from a cohort of 98 patients. They detected thousands of transcriptional elements that were differentially expressed between the CLL and normal B cells or exhibit CLL-specific splicing patterns. They also identified a major molecular and clinical subdivision in CLL.
Methods
- Bioanalyzer 2100
- RNA-seq libraries
- cDNA libraries
- Illumina Sequencing
- Robust Multi-array Average (RMA)
- Gene, transcript and exon quantifications:
- Flux Capacitor program
- Ward method
- The distance 1-r
- Multi Dimensional Scaling
- SPSS Statistics 20.0
- Kaplan and Meier method
- Multivariate analysis
Results
1. The gene expression landscape of CLL
The authors found 1089 genes differentially expressed between the CLL and normal B cells (Table 1). As was expected, the most differentially expressed genes are immunoglobulins due to the clonality of the CLL cells. Pathway analyses revealed that genes involved in metabolic pathways had higher expression in CLL, while genes related to splicesome, proteasome, and ribosome were substantially down-regulated in CLL.
Table 1. Expression and splicing differences between the different groups analyzed.
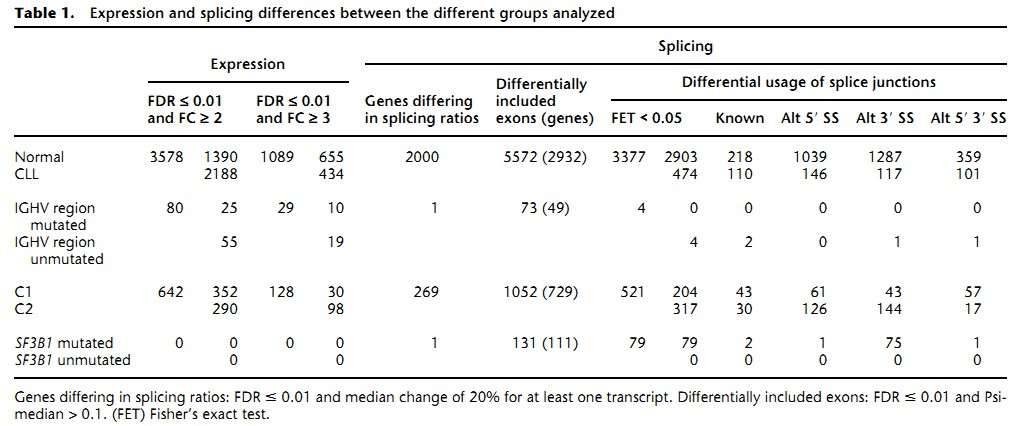
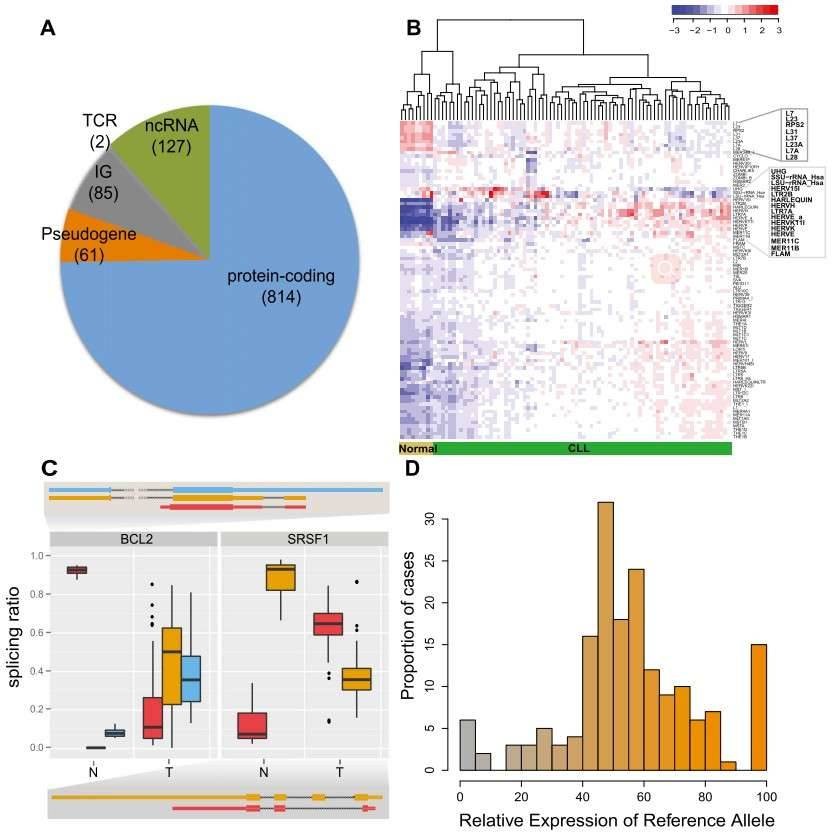 Figure 1. CLL transcriptional landscape. (A) The coding potential of differentially expressed genes between the CLL and normal samples. (B) Normalized expression of transposable elements (TEs). (C) Genes with condition-specific splicing ratios. (D) Allele-specific expression of somatic mutations.
2. The splicing landscape of CLL
The authors identified 2000 genes with significant differences in the relative ratios of alternative splice isoforms between the CLL and normal cells, including genes with well-known alternative isoforms as cancer biomarkers, such as RAC1, CD44, and BCL2L1. Changes in the BCR pathway were identified at expression level and the splicing level (Figure 2).
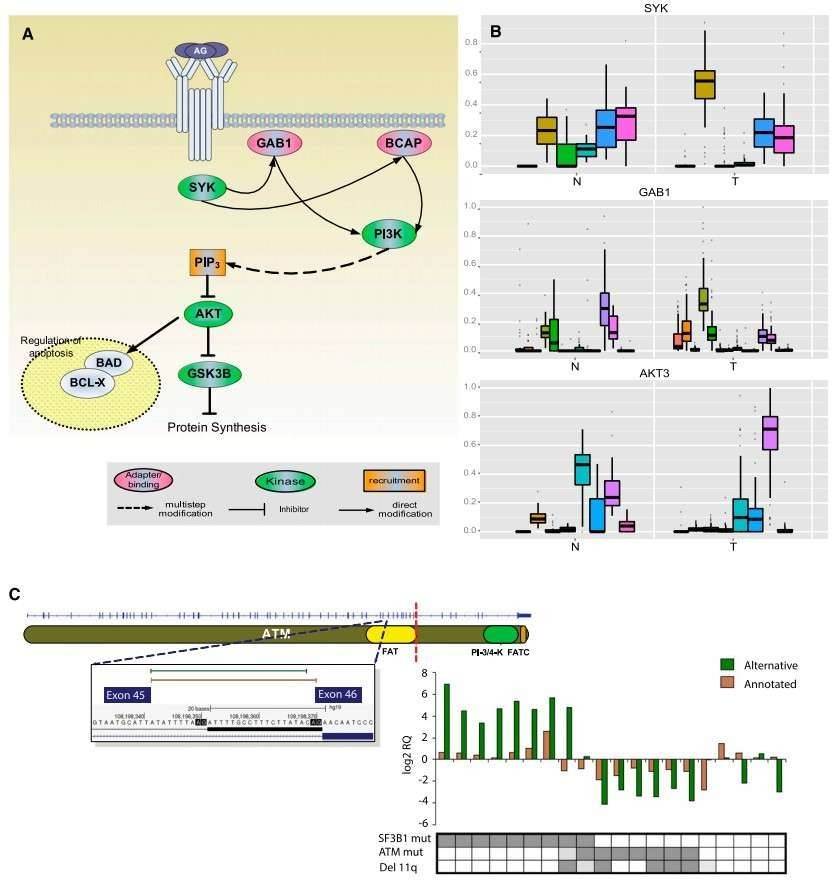 Figure 2. Splicing changes in the BCR pathway between normal (N) and tumor (T) samples.
3. Transcriptional chimeras in CLL
Gene fusions leading to chimeric proteins constitute an important mechanism of carcinogenesis. The authors identified 122 chimeric junctions exclusively present in CLL cell with RNA-seq analysis. They selected two chimeras (the FCRL2-FCRL3 chimeric junction and the GAB1-SMARCA5 chimeric junction) for further validation by PCR and Sanger sequencing,
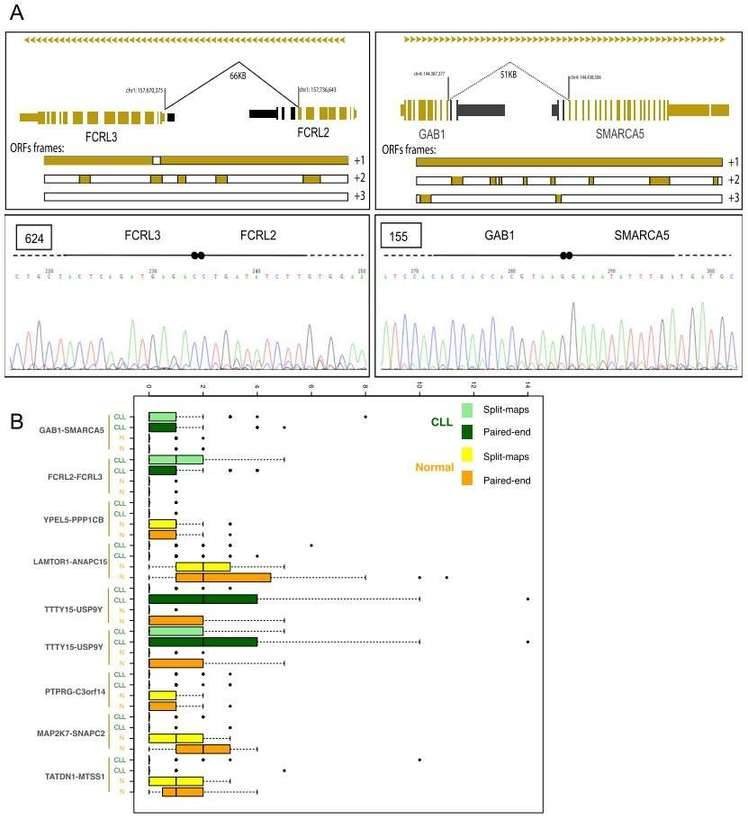 Figure 3. Chimeric junctions between FCRL2-FCRL3 and GAB1-SMARCA5.
4. Identification of two major transcriptional CLL subgroups
Hierarchical clustering of the RNA-seq samples based on gene expression clearly separated normal cells from tumor samples (Figure 4A). The clustering revealed two large, strongly defined subgroups within CLL samples, which was further supported by multidimensional scaling and principal component analysis.
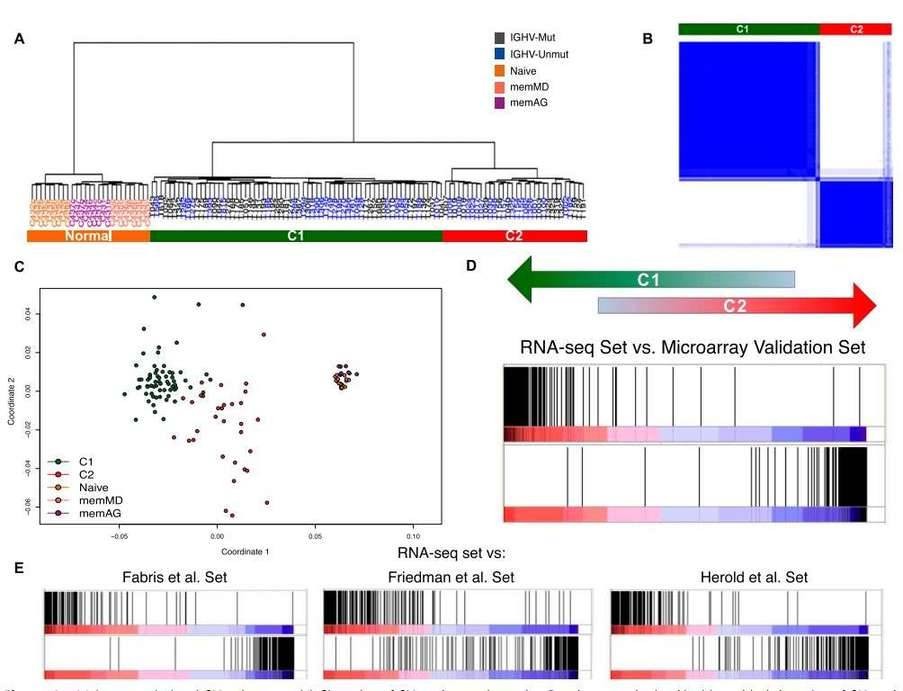 Figure 4. Major transcriptional CLL subgroups. (A) Clustering of CLL and normal samples. (B) Consensus cluster. (C) Multidimensional scaling of CLL and normal samples based on gene expression. (D&E) Enrichment score plot.
5. Clinical relevance of C1 and C2 CLL groups
The authors assessed the clinical impact of the C1 and C2 CLL groups. Compared with C1 patients, C2 patients had a higher frequency of mutations in genes related to adverse outcome and were more likely to be in the advanced Binet stage.
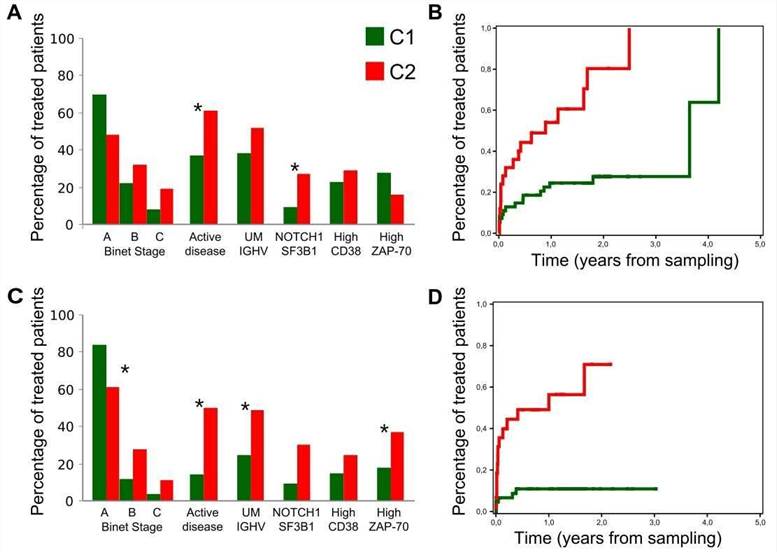 Figure 5. Clinical behavior of the C1 and C2 subgroups.
Conclusion
We identified differential expression of thousands of transcriptional elements between CLL and normal B cells, encompassing protein-coding genes, non-coding RNAs, and pseudogenes. Furthermore, a majority of genes displayed CLL-specific splice patterns. Through the cluster analysis of RNA sequencing data, we discerned two molecular subgroups, C1 and C2, closely related to clinical biological characteristics and treatment duration. Subsequent investigations suggested that B cell receptor (BCR) activation in the lymph node microenvironment may be the origin of C1/C2 differences.
Reference:
- Ferreira P G, Jares P, Rico D, et al. Transcriptome characterization by RNA sequencing identifies a major molecular and clinical subdivision in chronic lymphocytic leukemia. Genome research, 2014, 24(2): 212-226.
Here are some publications that have been successfully published using our services or other related services:
Long Non-Coding RNAs Might Regulate Phenotypic Switch of Vascular Smooth Muscle Cells Acting as ceRNA: Implications for In-Stent Restenosis
Journal: International Journal of Molecular Sciences
Year: 2022
A chemosensory-like histidine kinase is dispensable for chemotaxis in vitro but regulates the virulence of Borrelia burgdorferi through modulating the stability of RpoS
Journal: PLoS Pathogens
Year: 2023
Blood RNA-Seq profiling reveals a set of circular RNAs differentially expressed in frail individuals
Journal: Immunity & Ageing
Year: 2023
Targeting the CLK2/SRSF9 splicing axis in prostate cancer leads to decreased ARV7 expression
Journal: Molecular Oncology
Year: 2024
Skin Microbial Community Associated to Strawberry Disease in Farmed Rainbow Trout (Oncorhynchus mykiss Walbaum, 1792)
Journal: Microorganisms
Year: 2024
A recombination-resistant genome for live attenuated and stable PEDV vaccines by engineering the transcriptional regulatory sequences
Journal: Journal of Virology
Year: 2023
See more articles published by our clients.


